Case study
High-voltage power grid
Elia
Four and a half years on the experience of EPIC, the portal that brings Elia's digital services together for industrial clients connected to Belgium's high-voltage grid, including TotalEnergies, BASF and ArcelorMittal.
Key result
Live since June 2021, EPIC became Elia's single digital front door for up to 1,300 industrial accounts.
01 EPIC
One portal for Elia's services.
Context
Metering, invoicing, contracts, load management: Elia's digital services were scattered, and an industrial client had to juggle several entry points for a single relationship. EPIC had to bring them into one journey while respecting the rules of a regulated sector: who sees what, who signs what, on behalf of which company. I led the full UX cycle, from discovery to the high-fidelity prototype handed over to development.
Objectives
- A single front door — bring metering, invoicing, contracts and load management into one journey.
- Reconcile grid and clients — turn the grid operator's technical and regulatory constraints into screens usable by industrial clients managing their costs, their sites and their projects.
- Room for new services — open the platform to services such as Insights, which help clients manage their consumption from their own data.
- Build with clients — gather feedback from several clients on an ongoing basis, so the roadmap rests on observed use.
Approach & solutions
- Double Diamond — from exploratory interviews with the Key Account Managers, who know each client from the inside, to wireframes and interactive Figma prototypes.
- Co-design workshops — IT, legal, sales and business at the same table: feasibility trade-offs were settled in the room, not in acceptance testing.
- Iterative research and testing — guided interviews and feedback sessions run directly with industrial partners, at every iteration.
- Design system — extending shared components and patterns (invoicing, insights, load management) so each new service reuses the same components as the rest.
Results
- Launch — EPIC has been live since June 2021 as the main touchpoint between Elia and its industrial clients, up to 1,300 accounts.
- Clients involved — major industrial clients take part in the platform's roadmap.
- Less routine work — clients are more autonomous, and Elia's teams spend less time on repetitive tasks and more on the cases that need them.
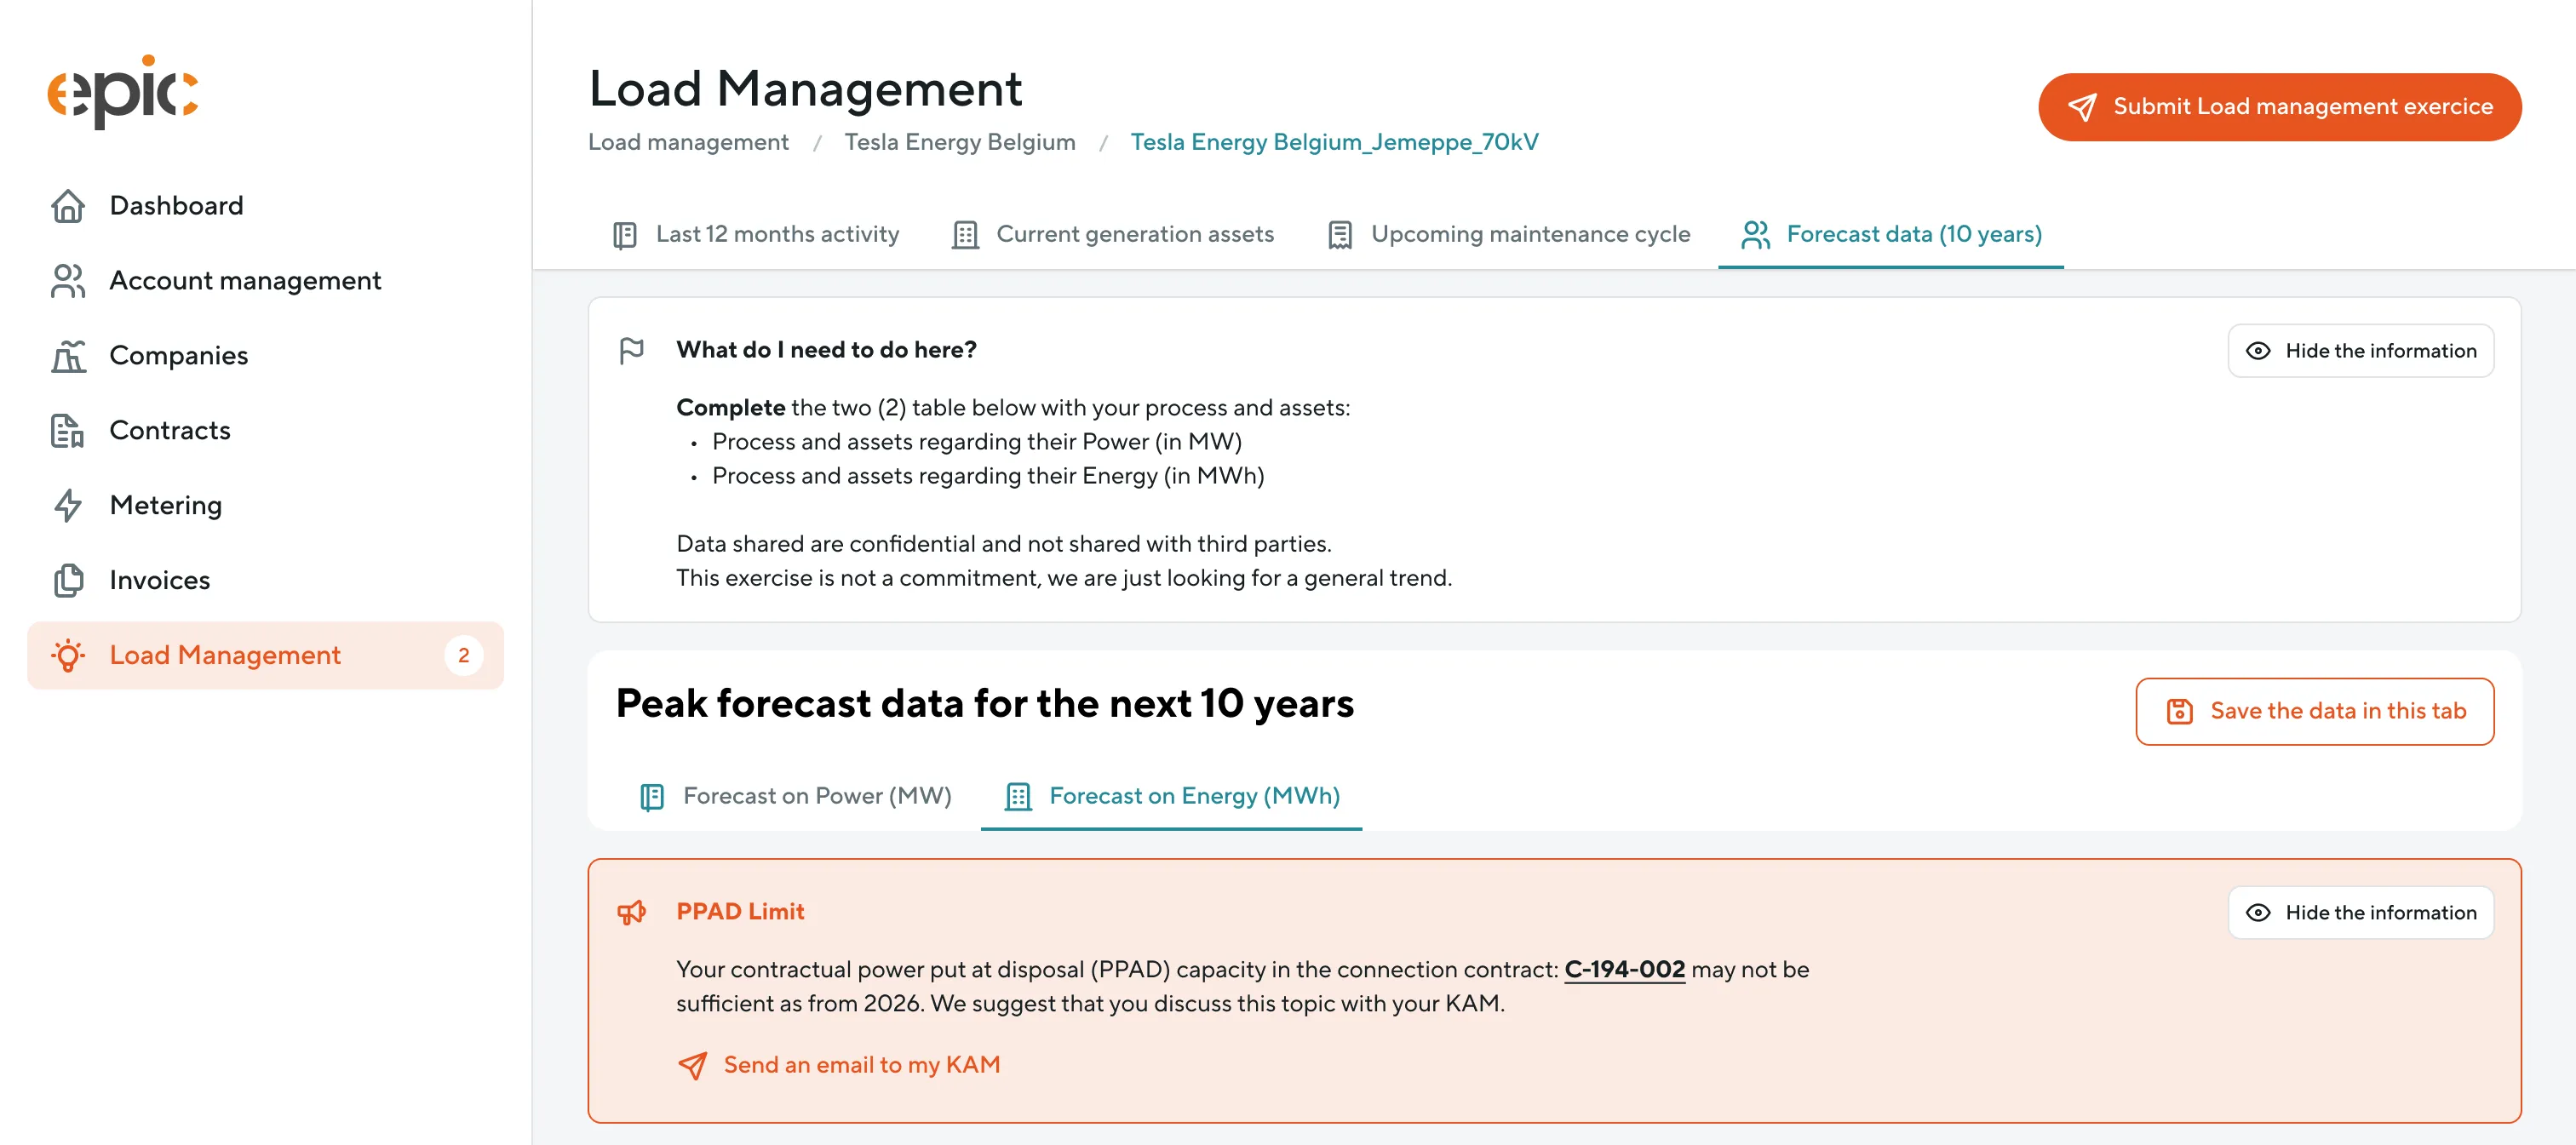
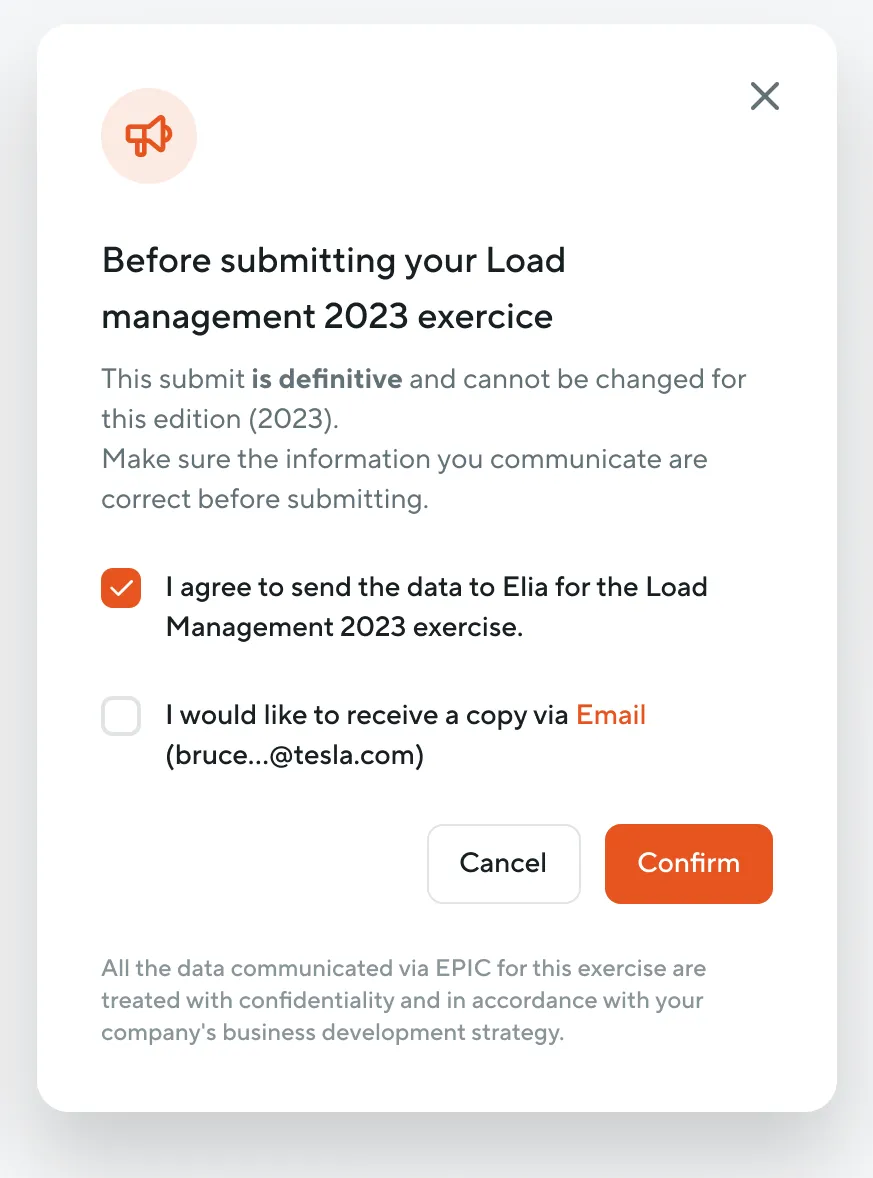
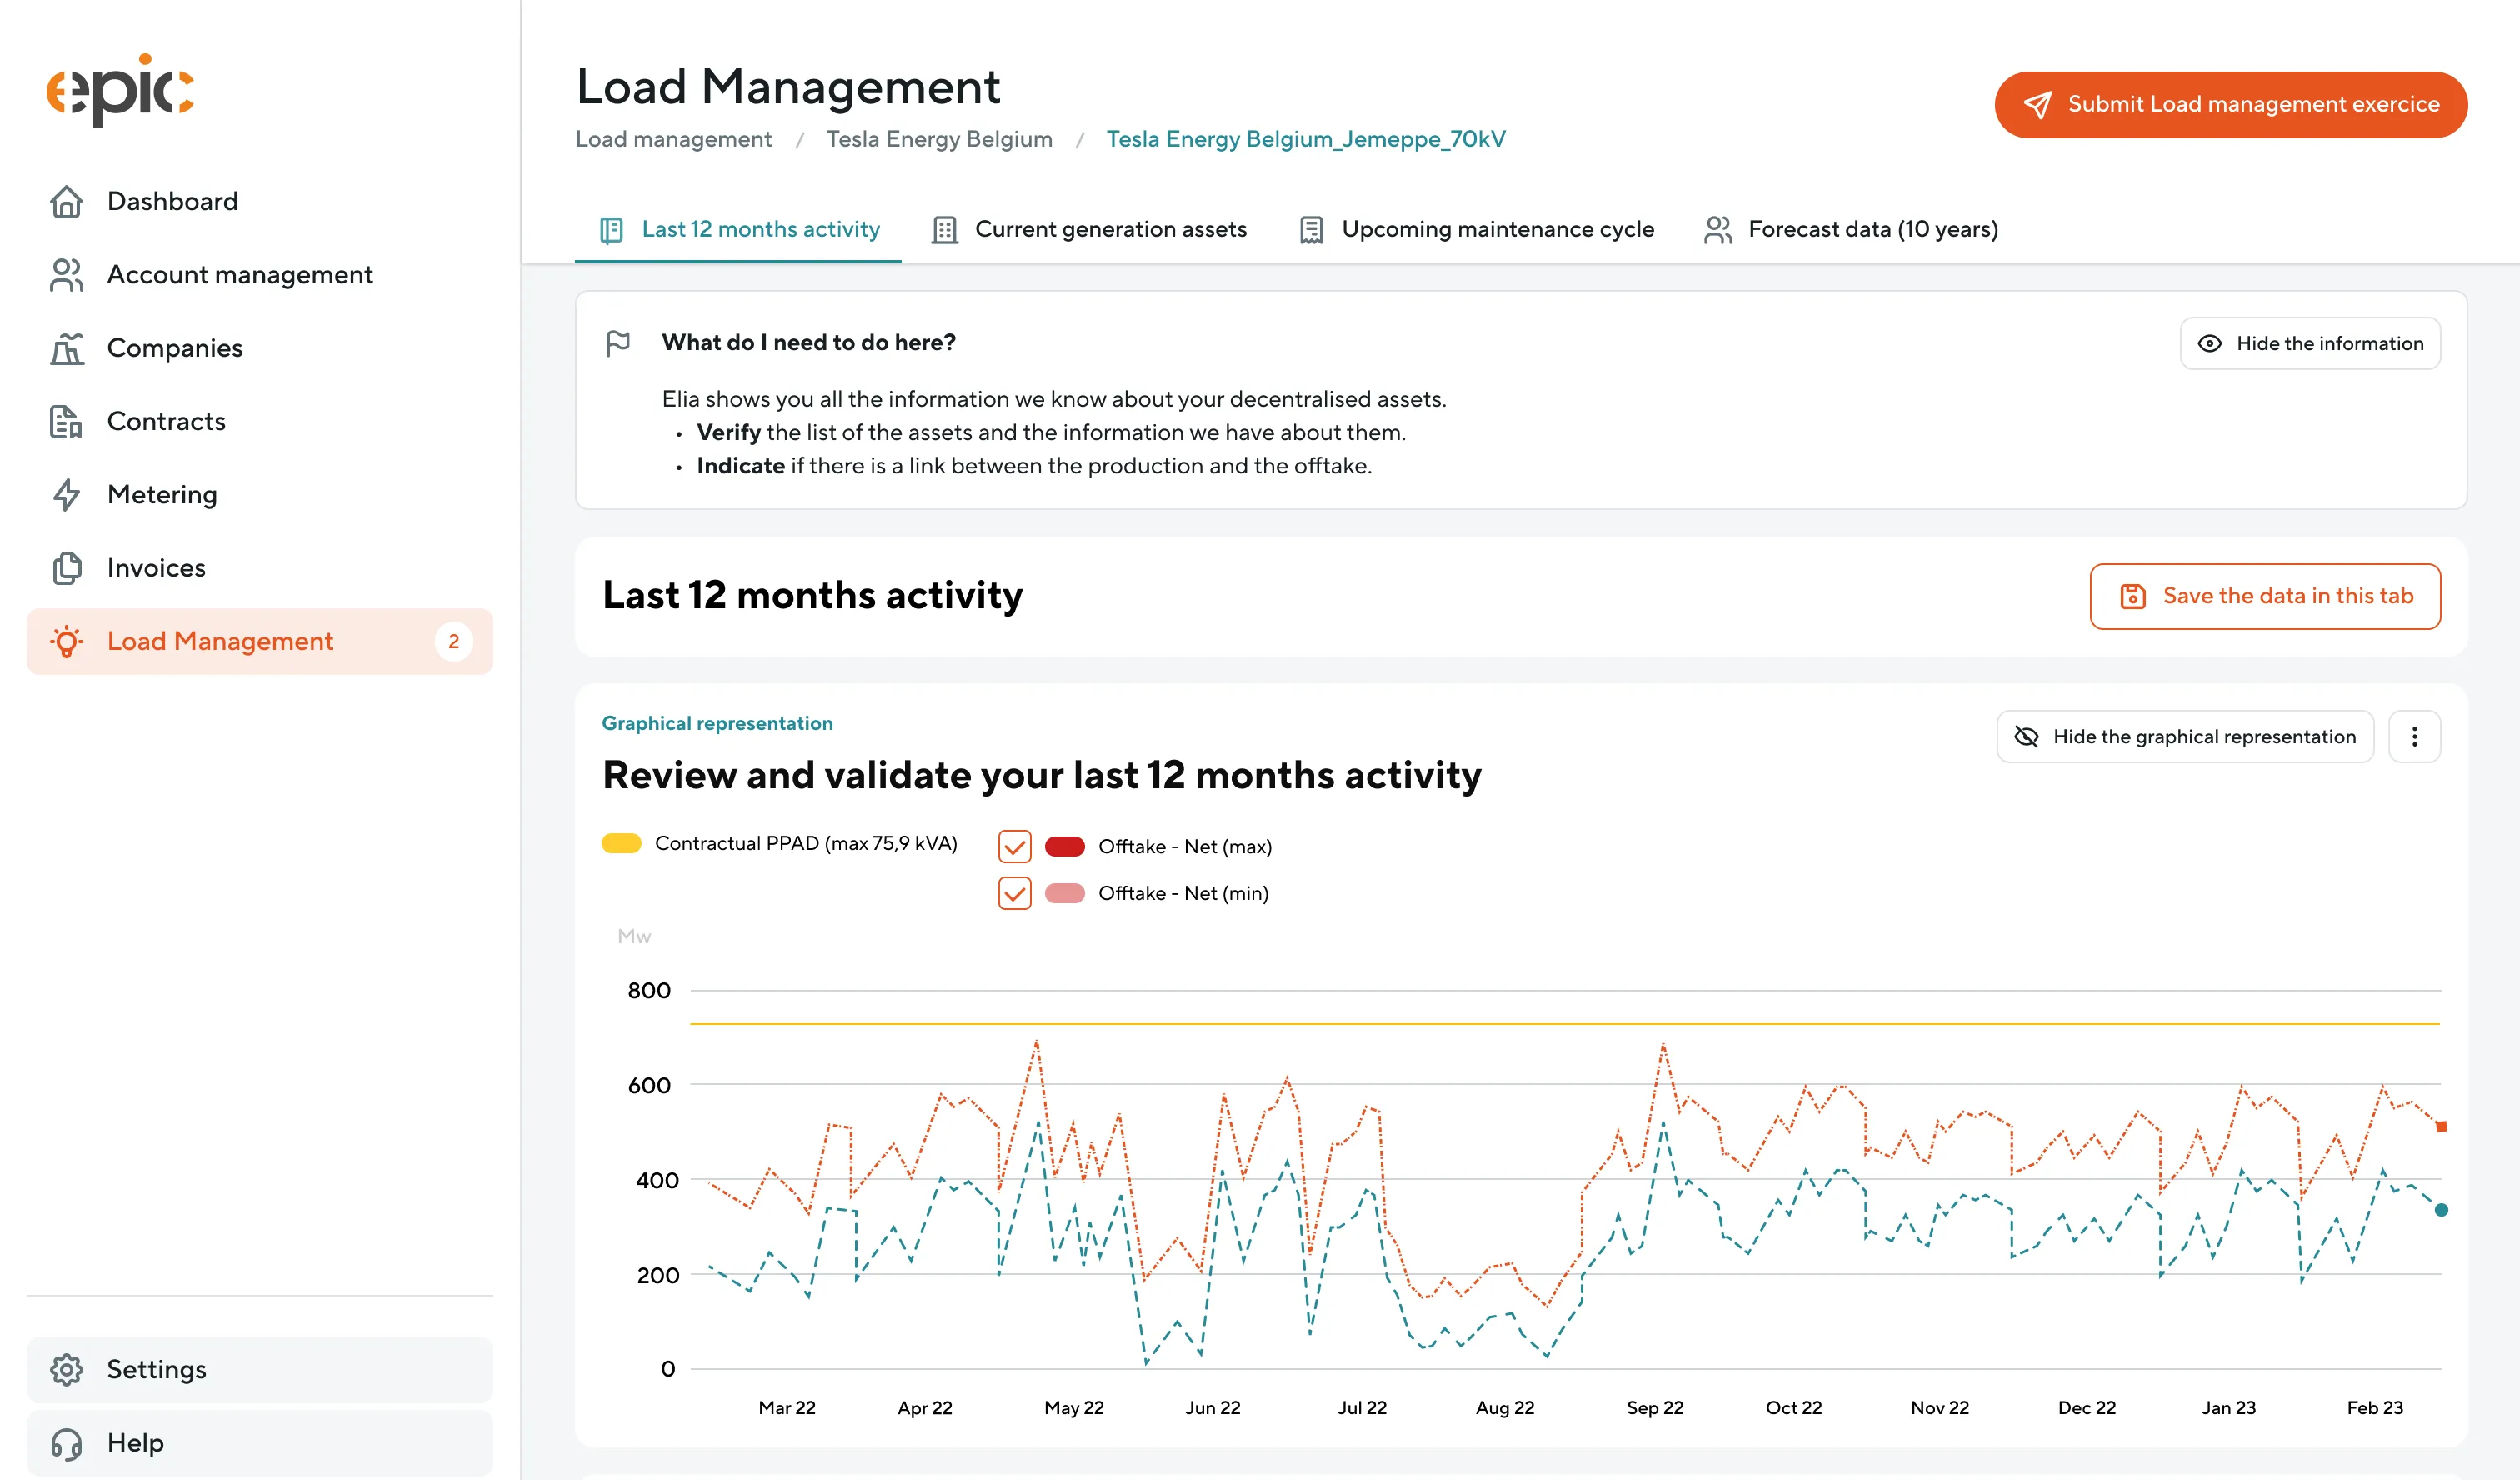
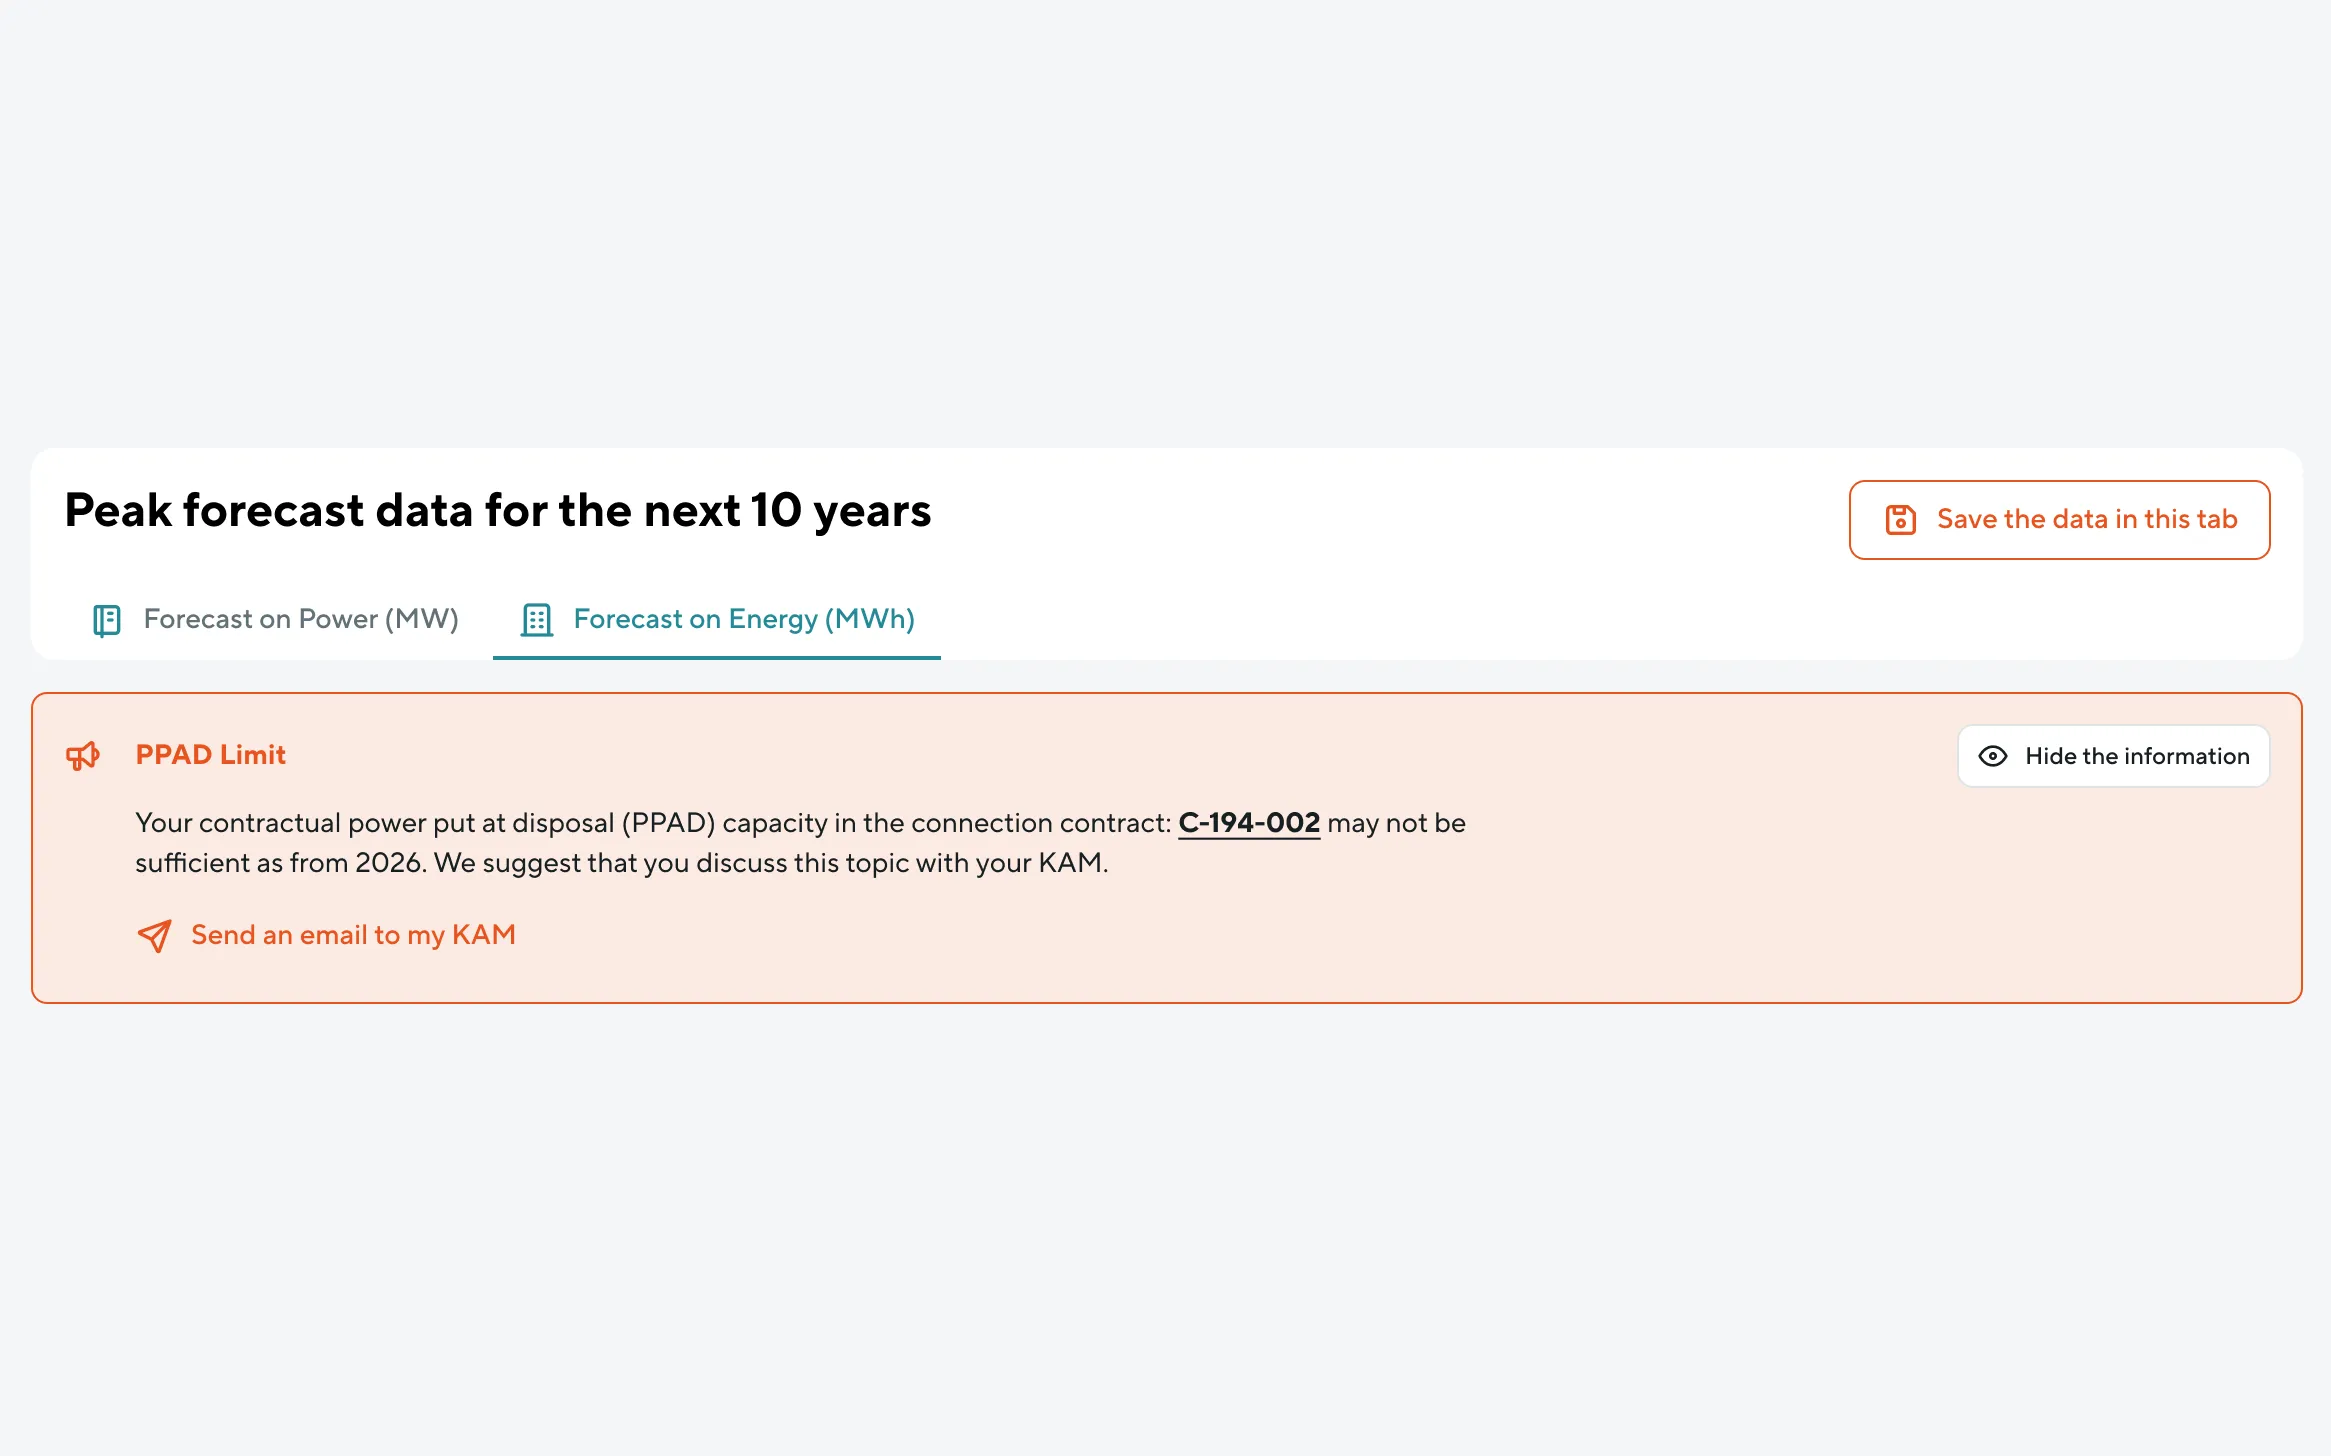
Load Management: the load forecast exercise
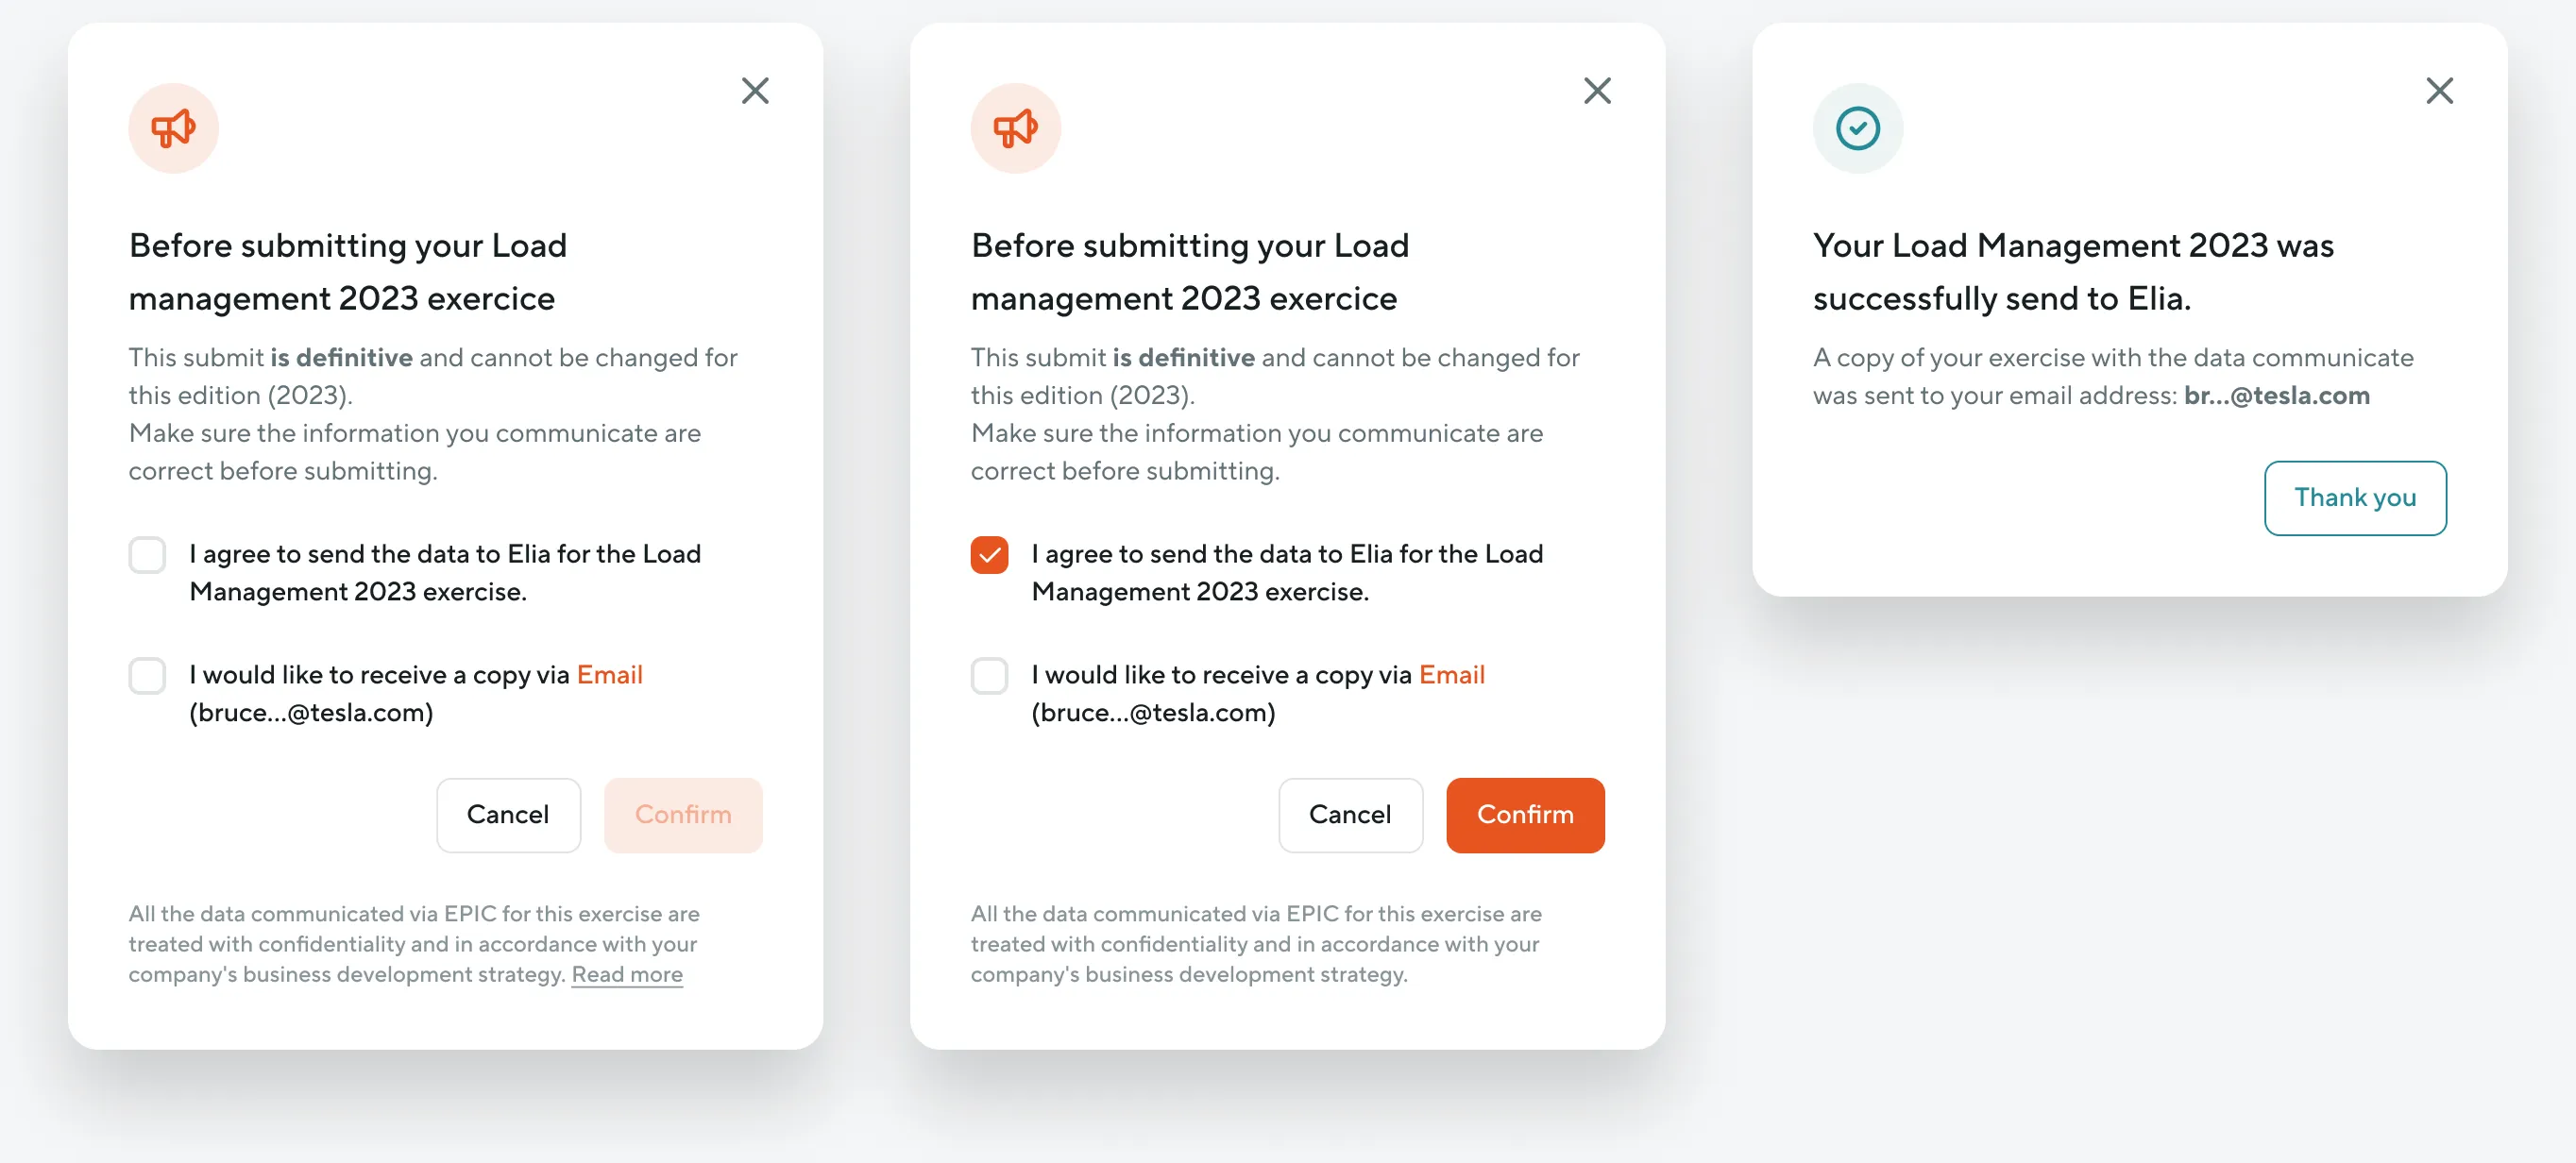
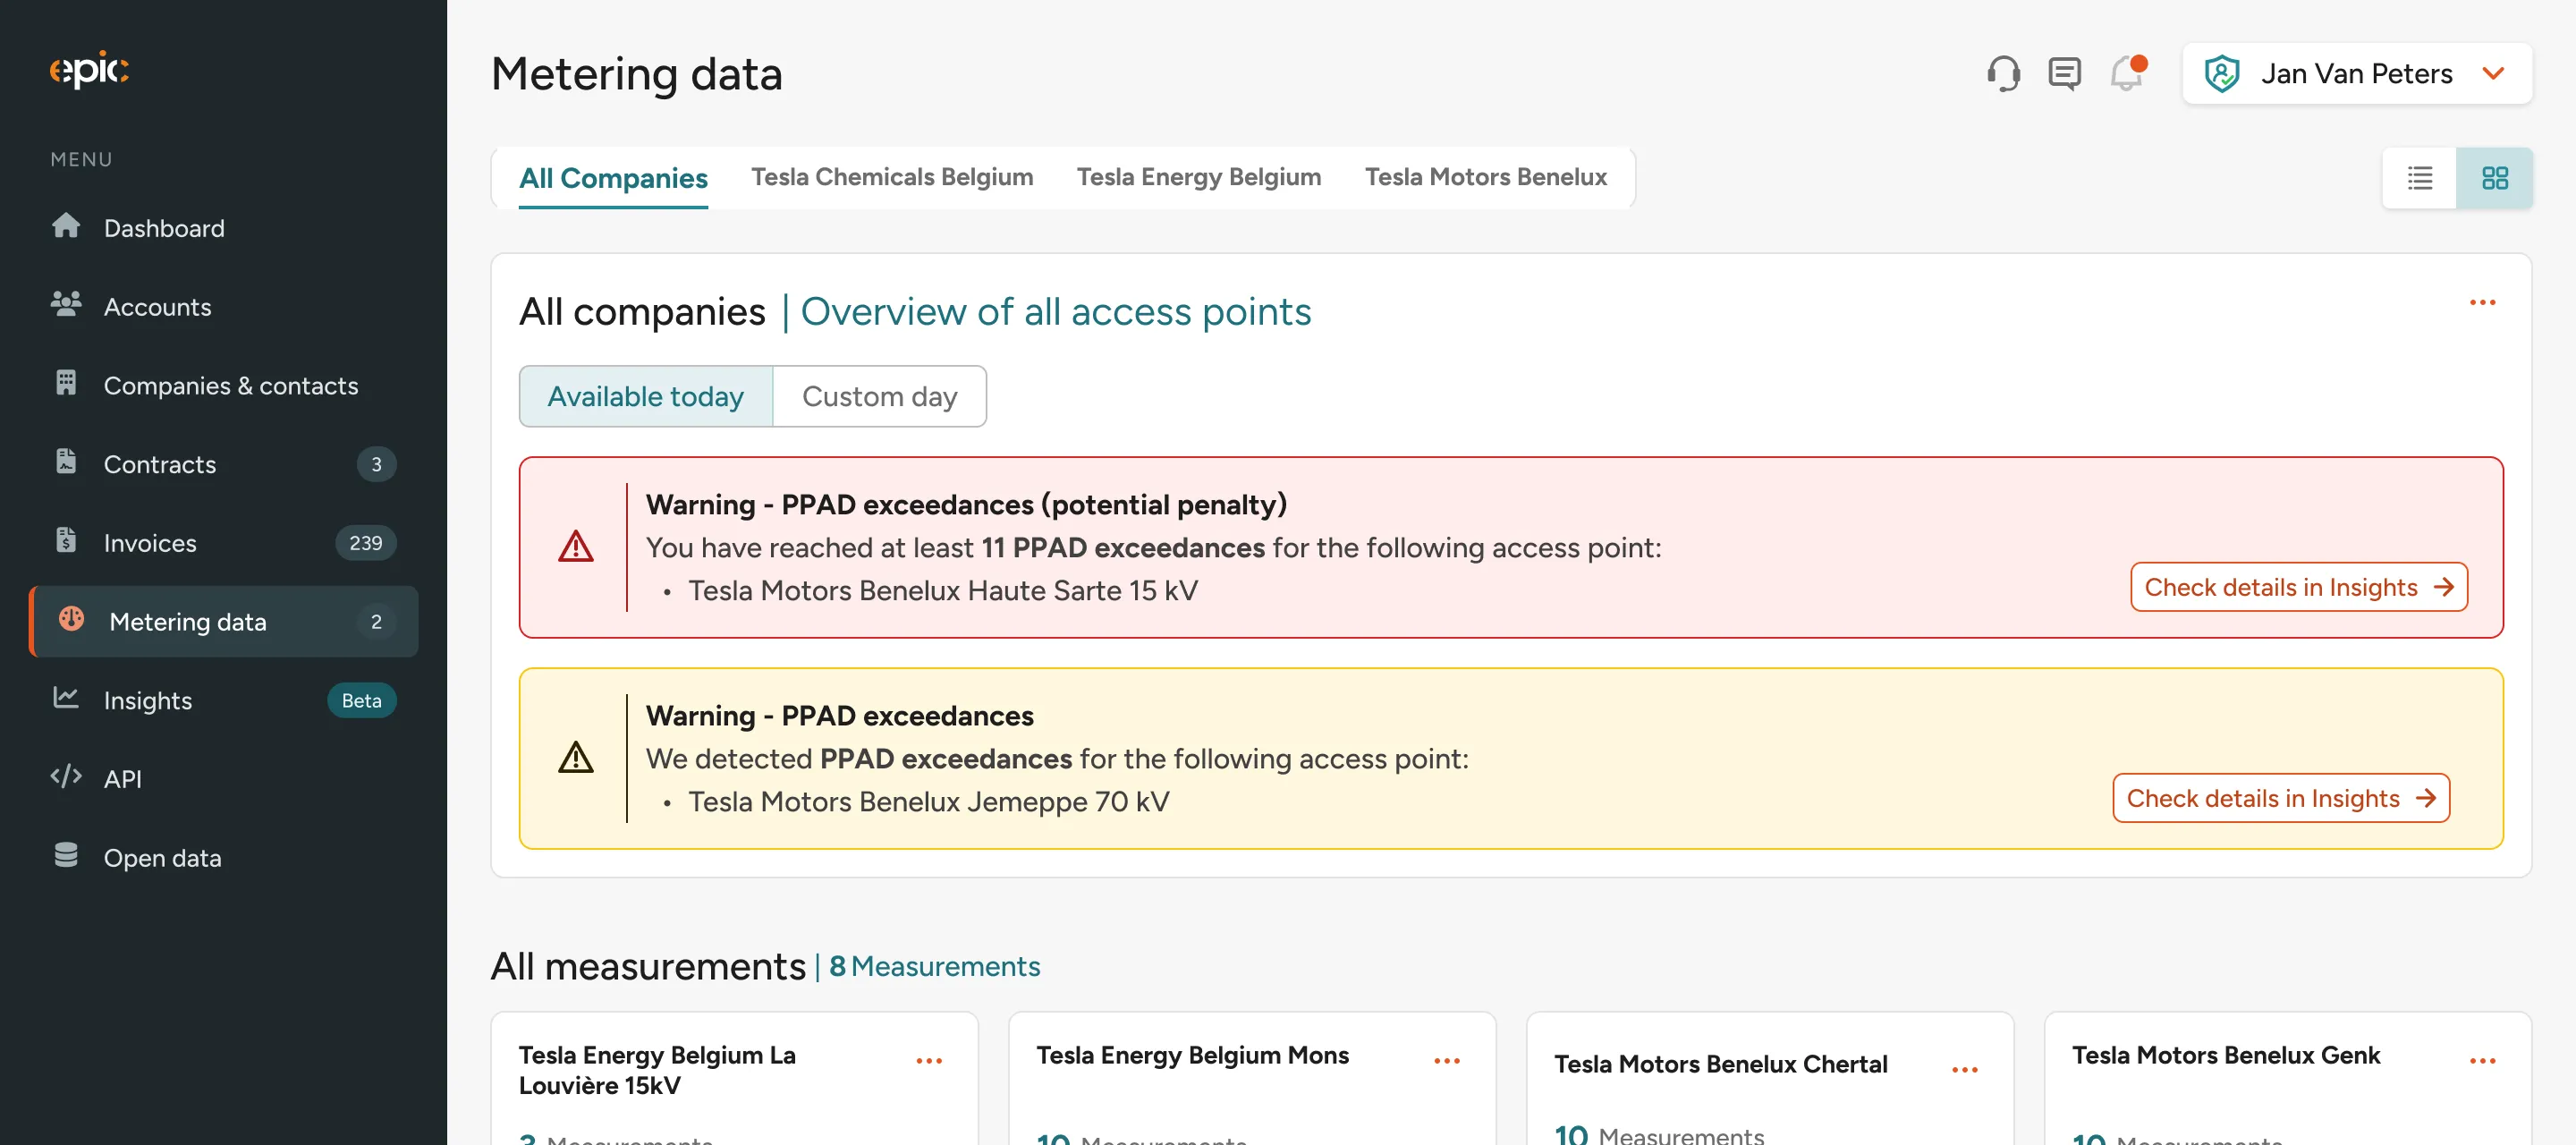
Each edition, industrial clients review what Elia knows about their assets and activity, then give their expected peaks over ten years, with no commitment, so a trend can emerge. Three screens of the journey, rebuilt on Nova, Elia's design system.
02 Insights (EPIC)
Grid data you can act on.
Context
Beyond metering and invoicing, Elia wanted its industrial clients to understand their effect on the Belgian grid and be able to act on it. Insights had to turn raw grid data into indicators for managing consumption and injection. I led the project from discovery, before a single line of code was written.
Objectives
- Frame it from discovery — identify what industrial clients actually need and what the service could bring to the business.
- Supporting grid stability — align industrial usage with the Belgian grid's balancing needs.
- Make the data usable — turn complex data into visualisations and messages an energy manager can act on.
- Align IT and business — start from user needs to get IT and business to agree on one vision.
Approach & solutions
- Upstream research — exploratory interviews and workshops to validate the need and the kind of data to show, before any IT investment.
- Prototypes put to the test — test cycles on high-fidelity prototypes, focused on legibility and how the data is represented.
- MVP, then iterations — Insights joins EPIC in increments, paced by both development sprints and research cycles.
- Early adopter programme — ten major industrials on the Belgian grid, selected to put each increment to the test.
Results
- Indicators to track — energy managers track indicators, such as PPAD exceedances, instead of digging through raw data.
- A roadmap discussed with users — backlog prioritised with the early adopters, increment after increment.
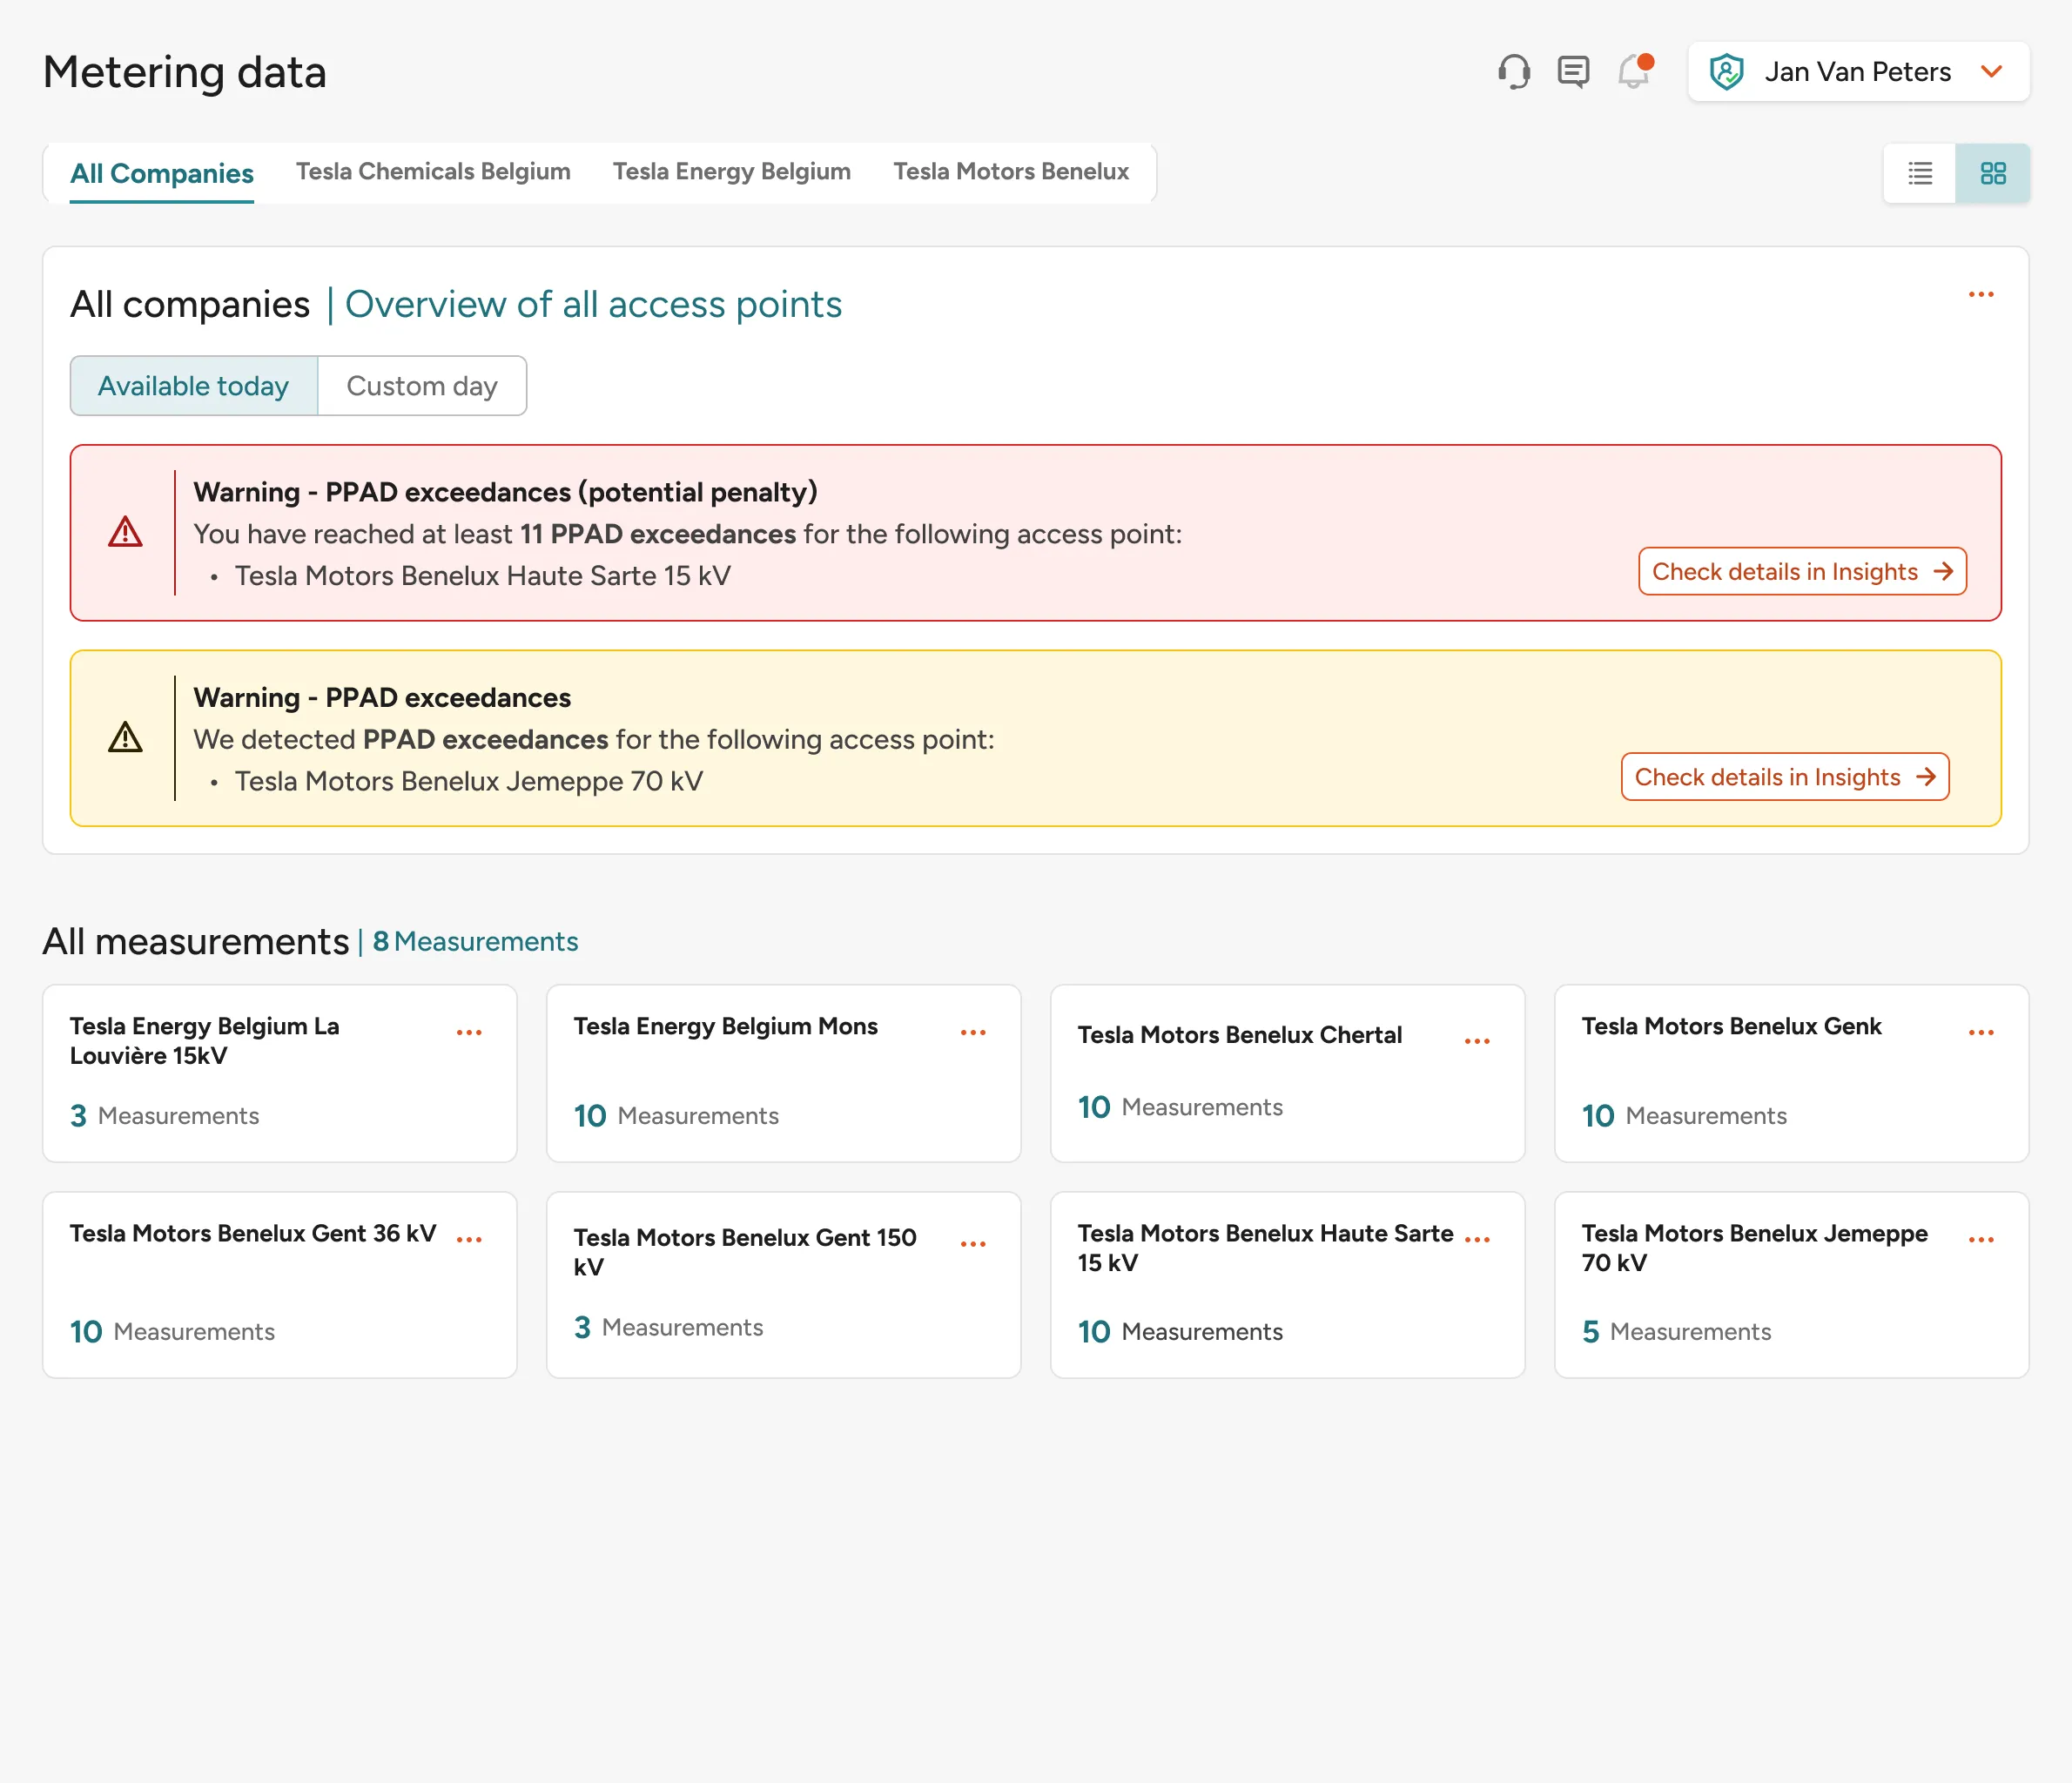
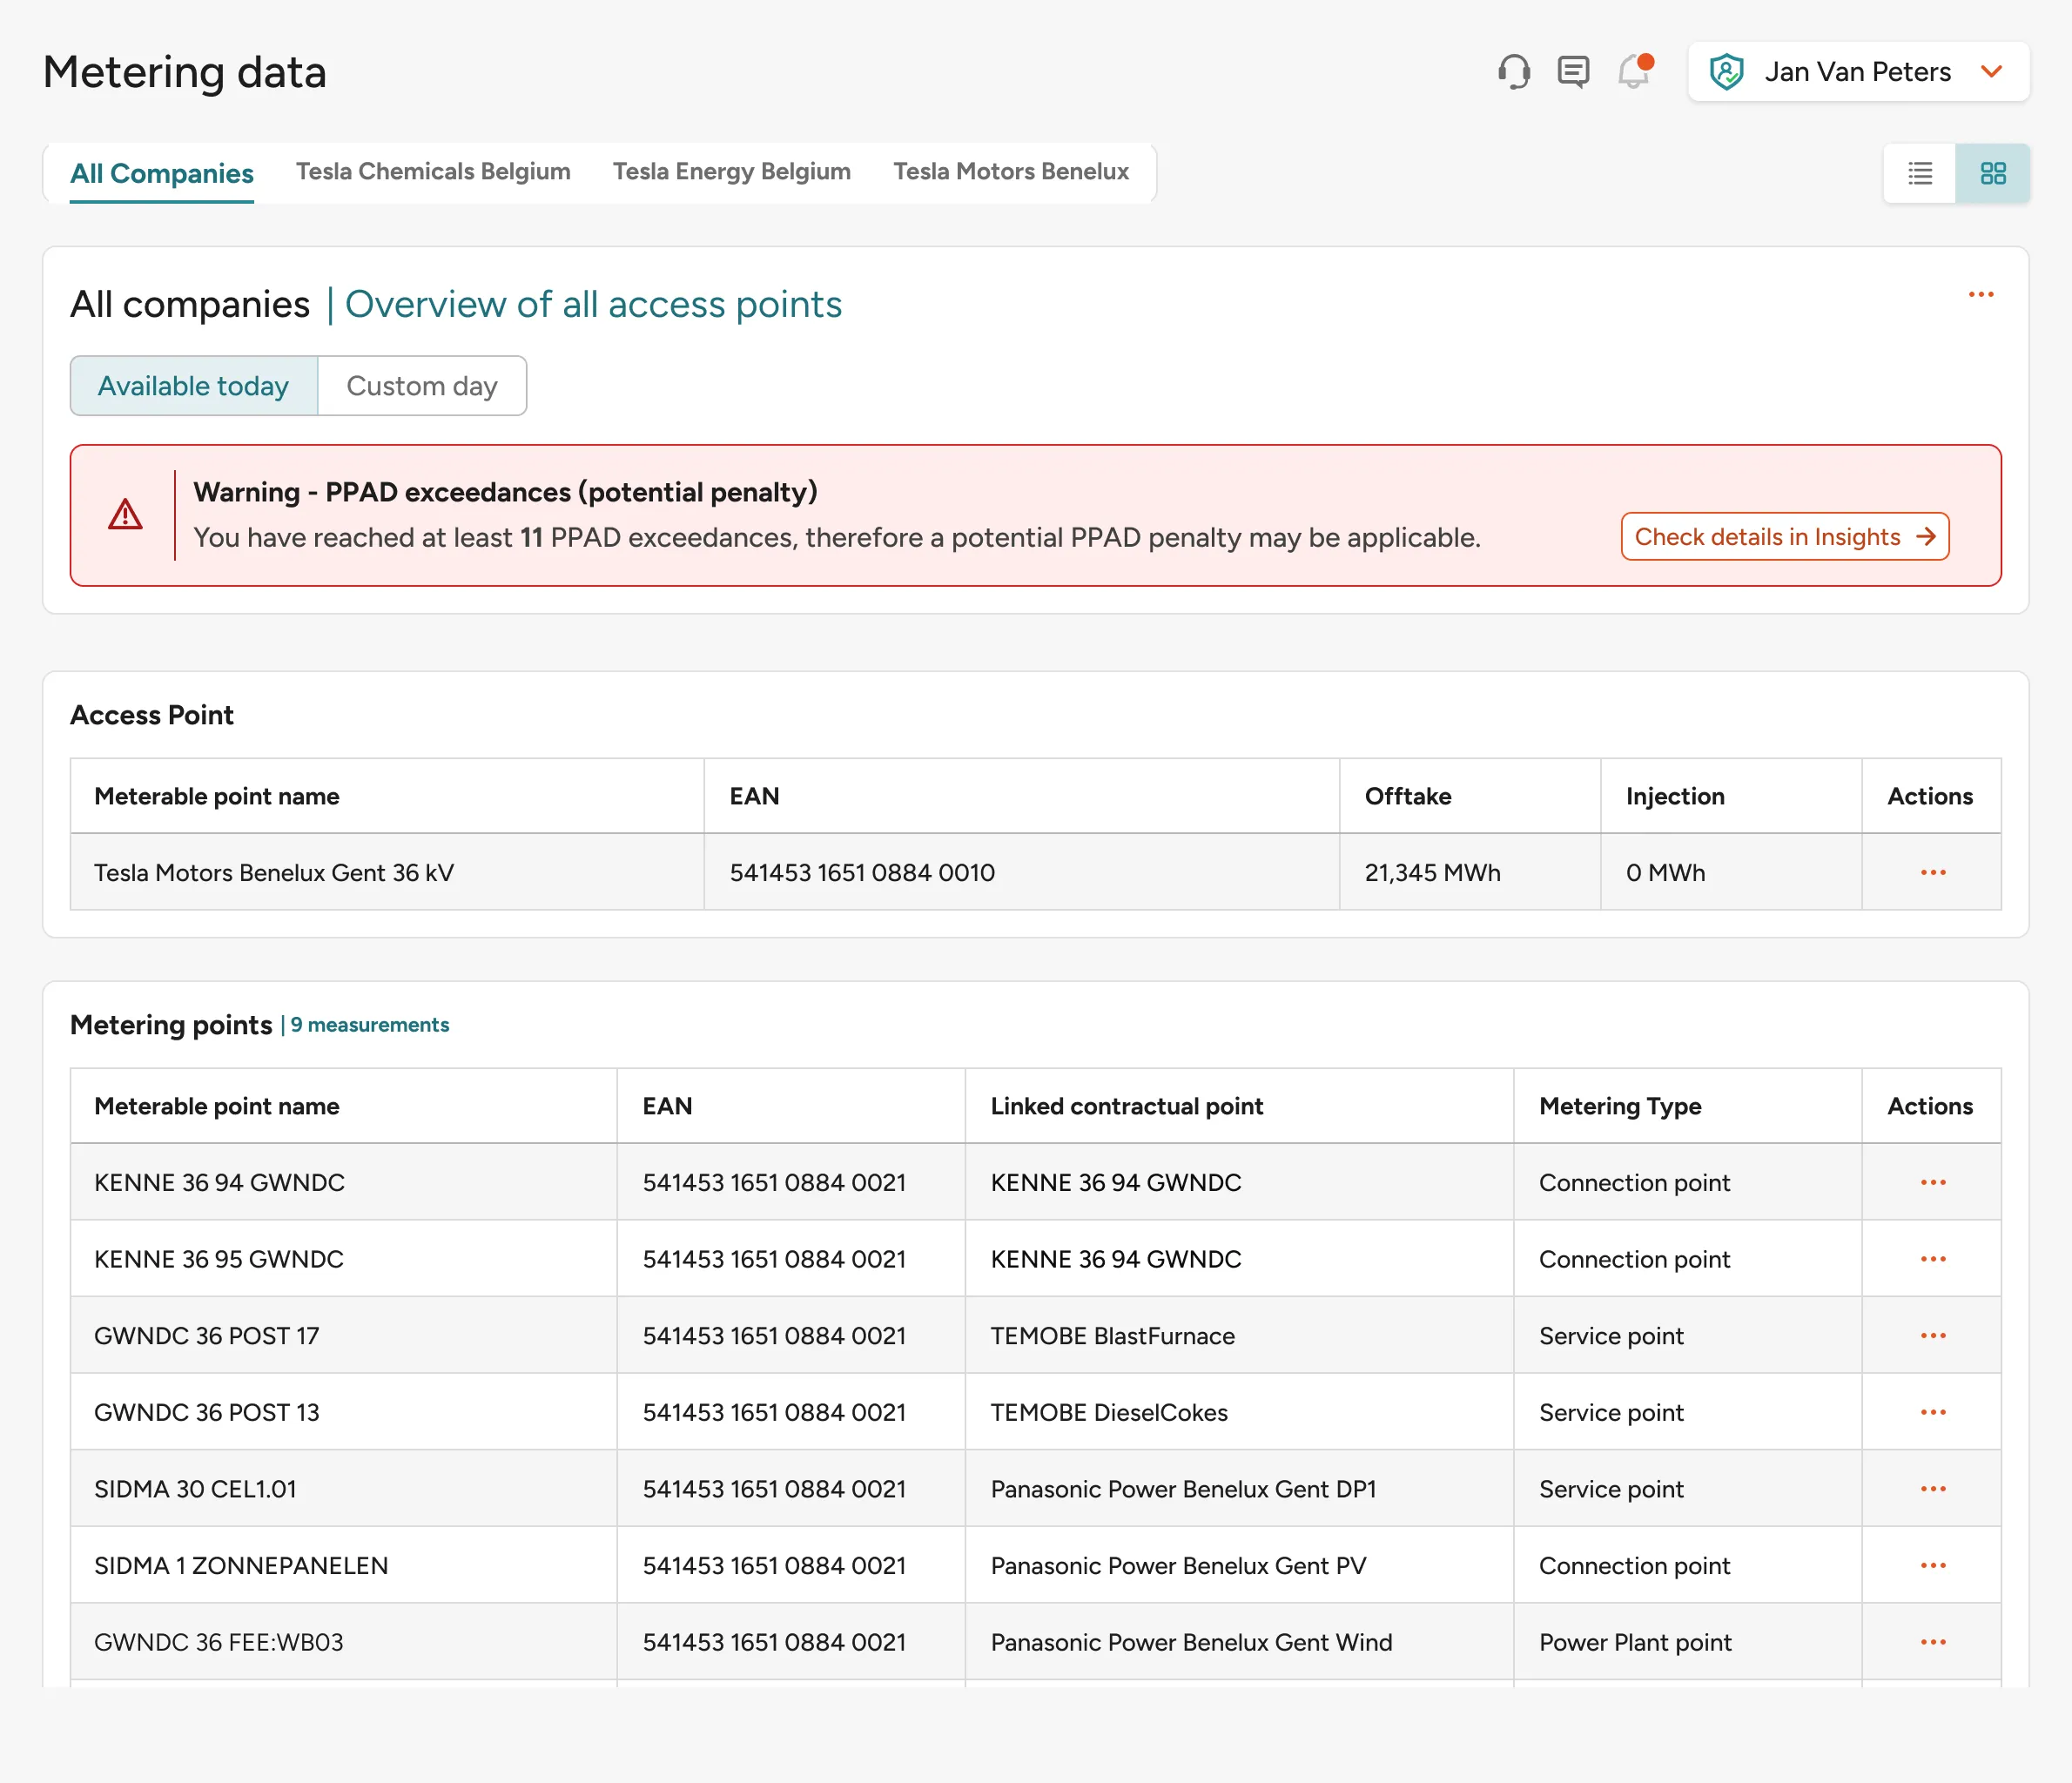
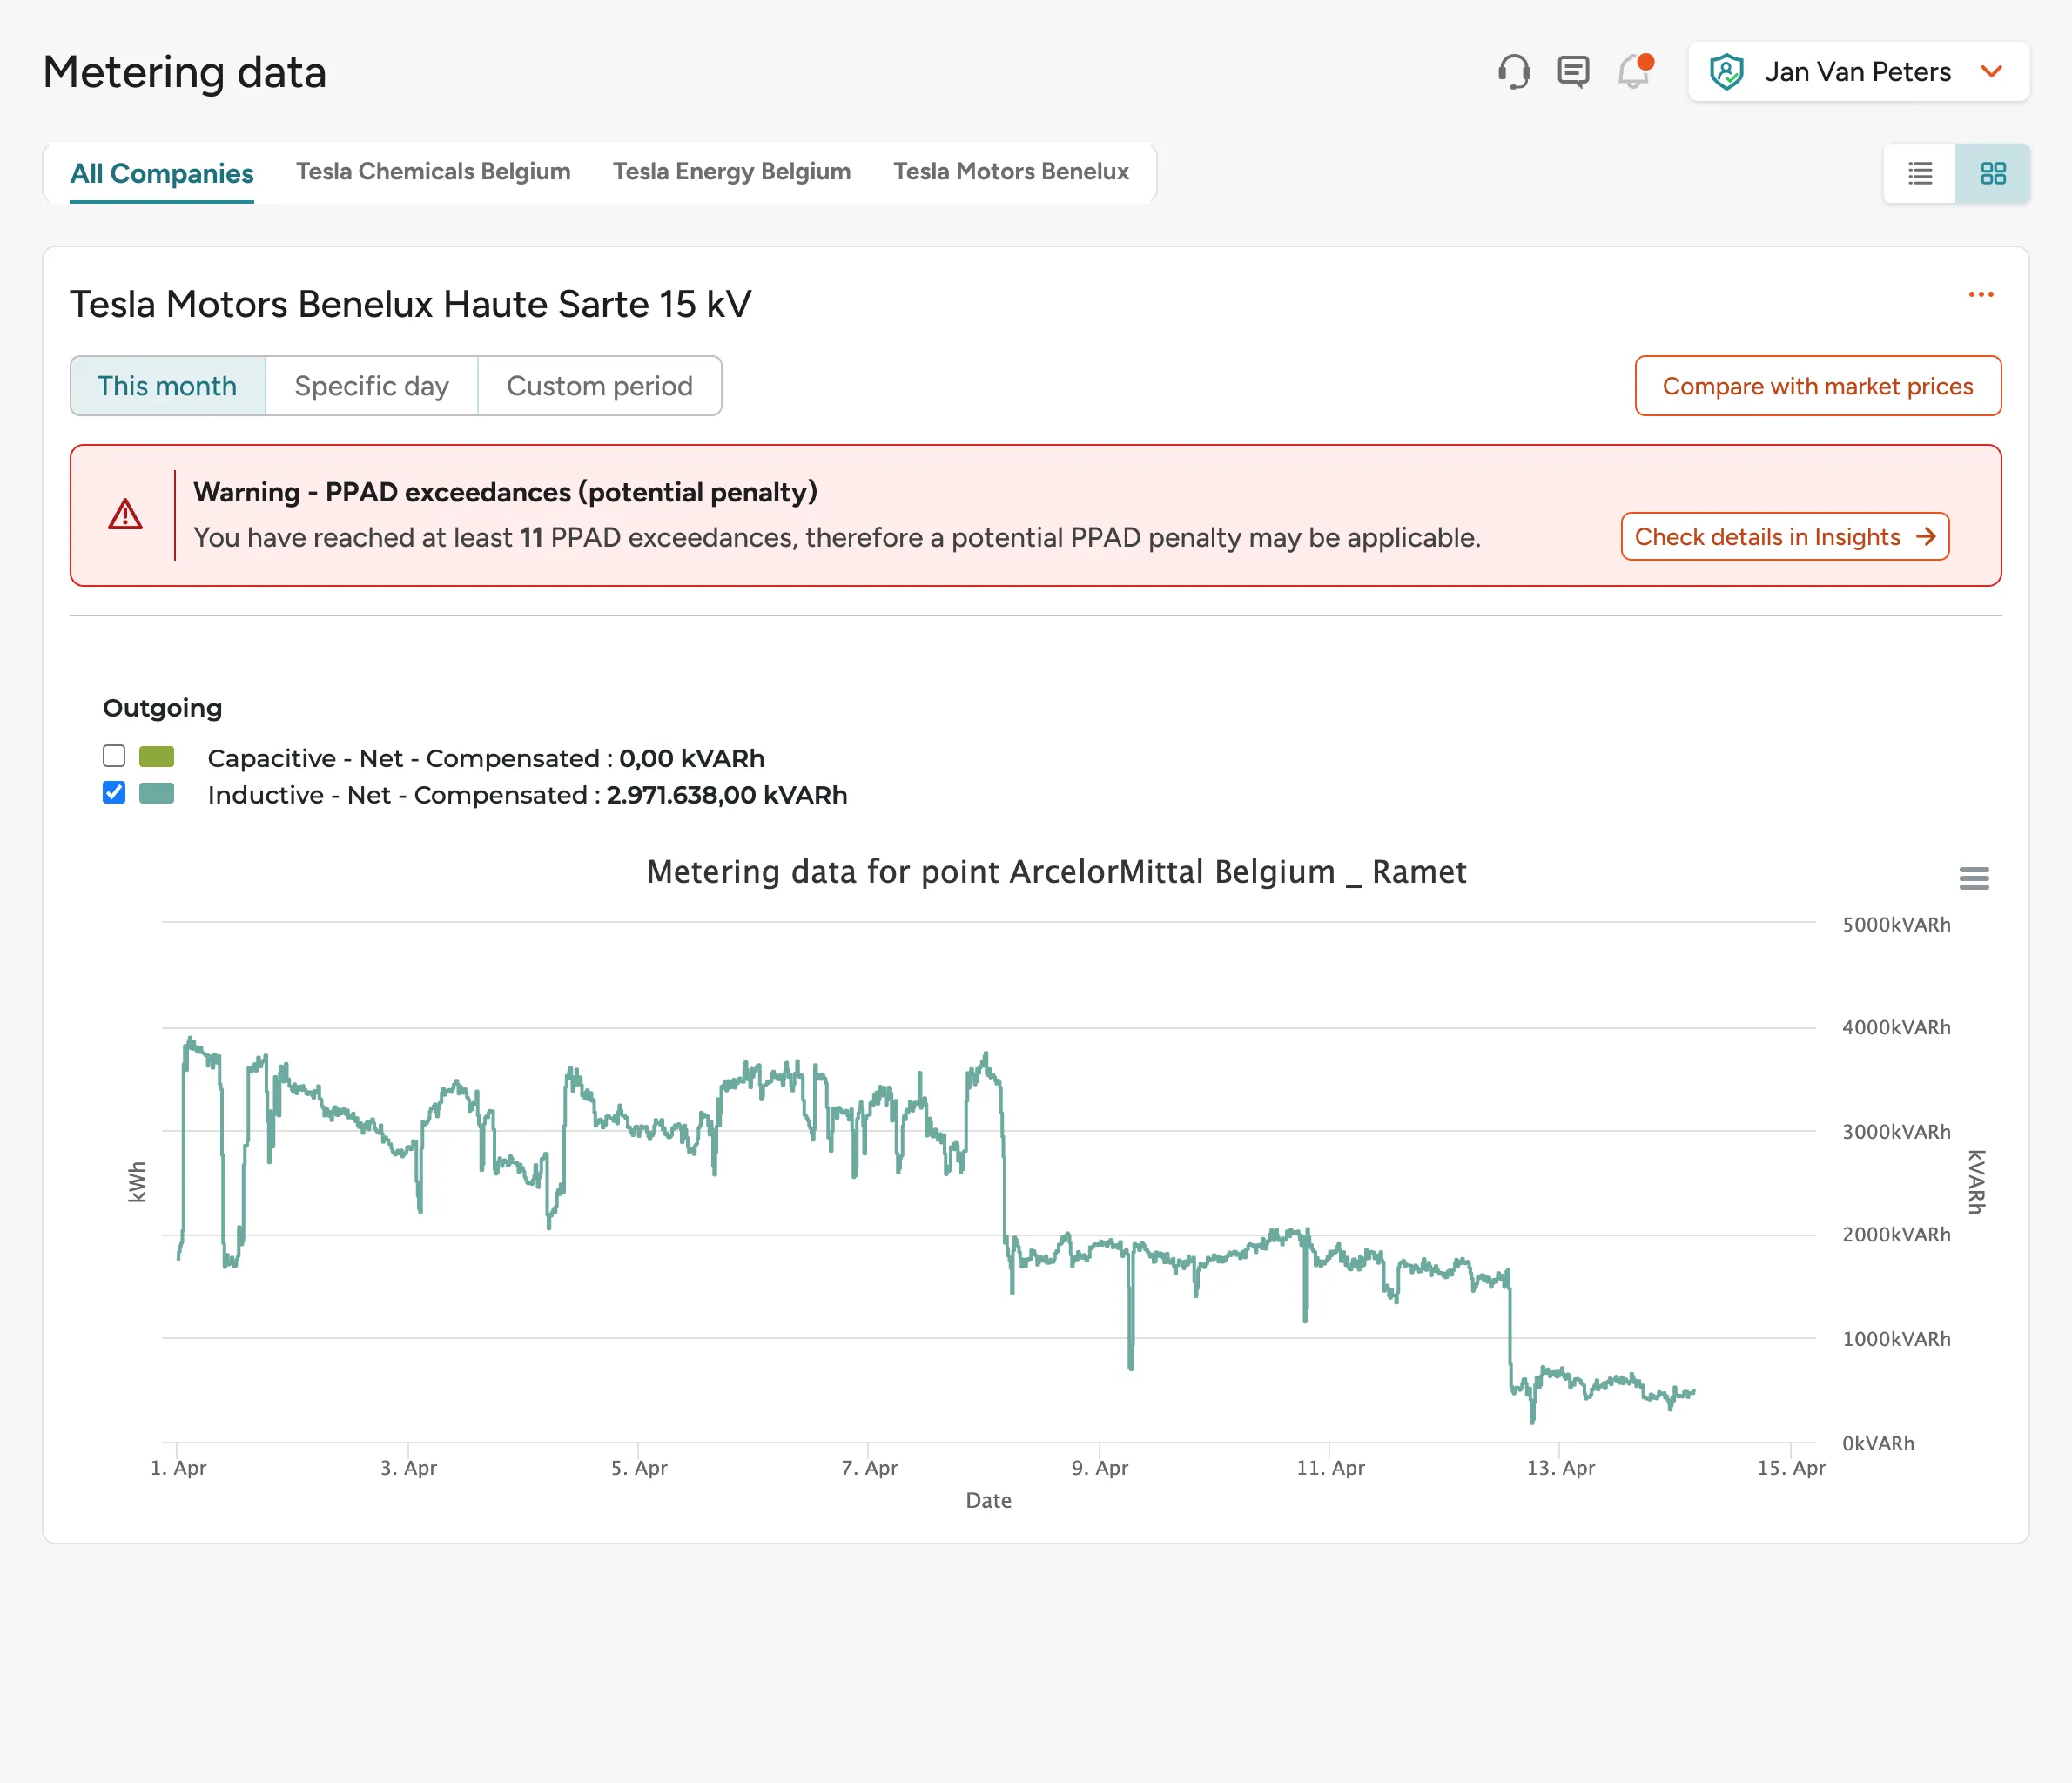
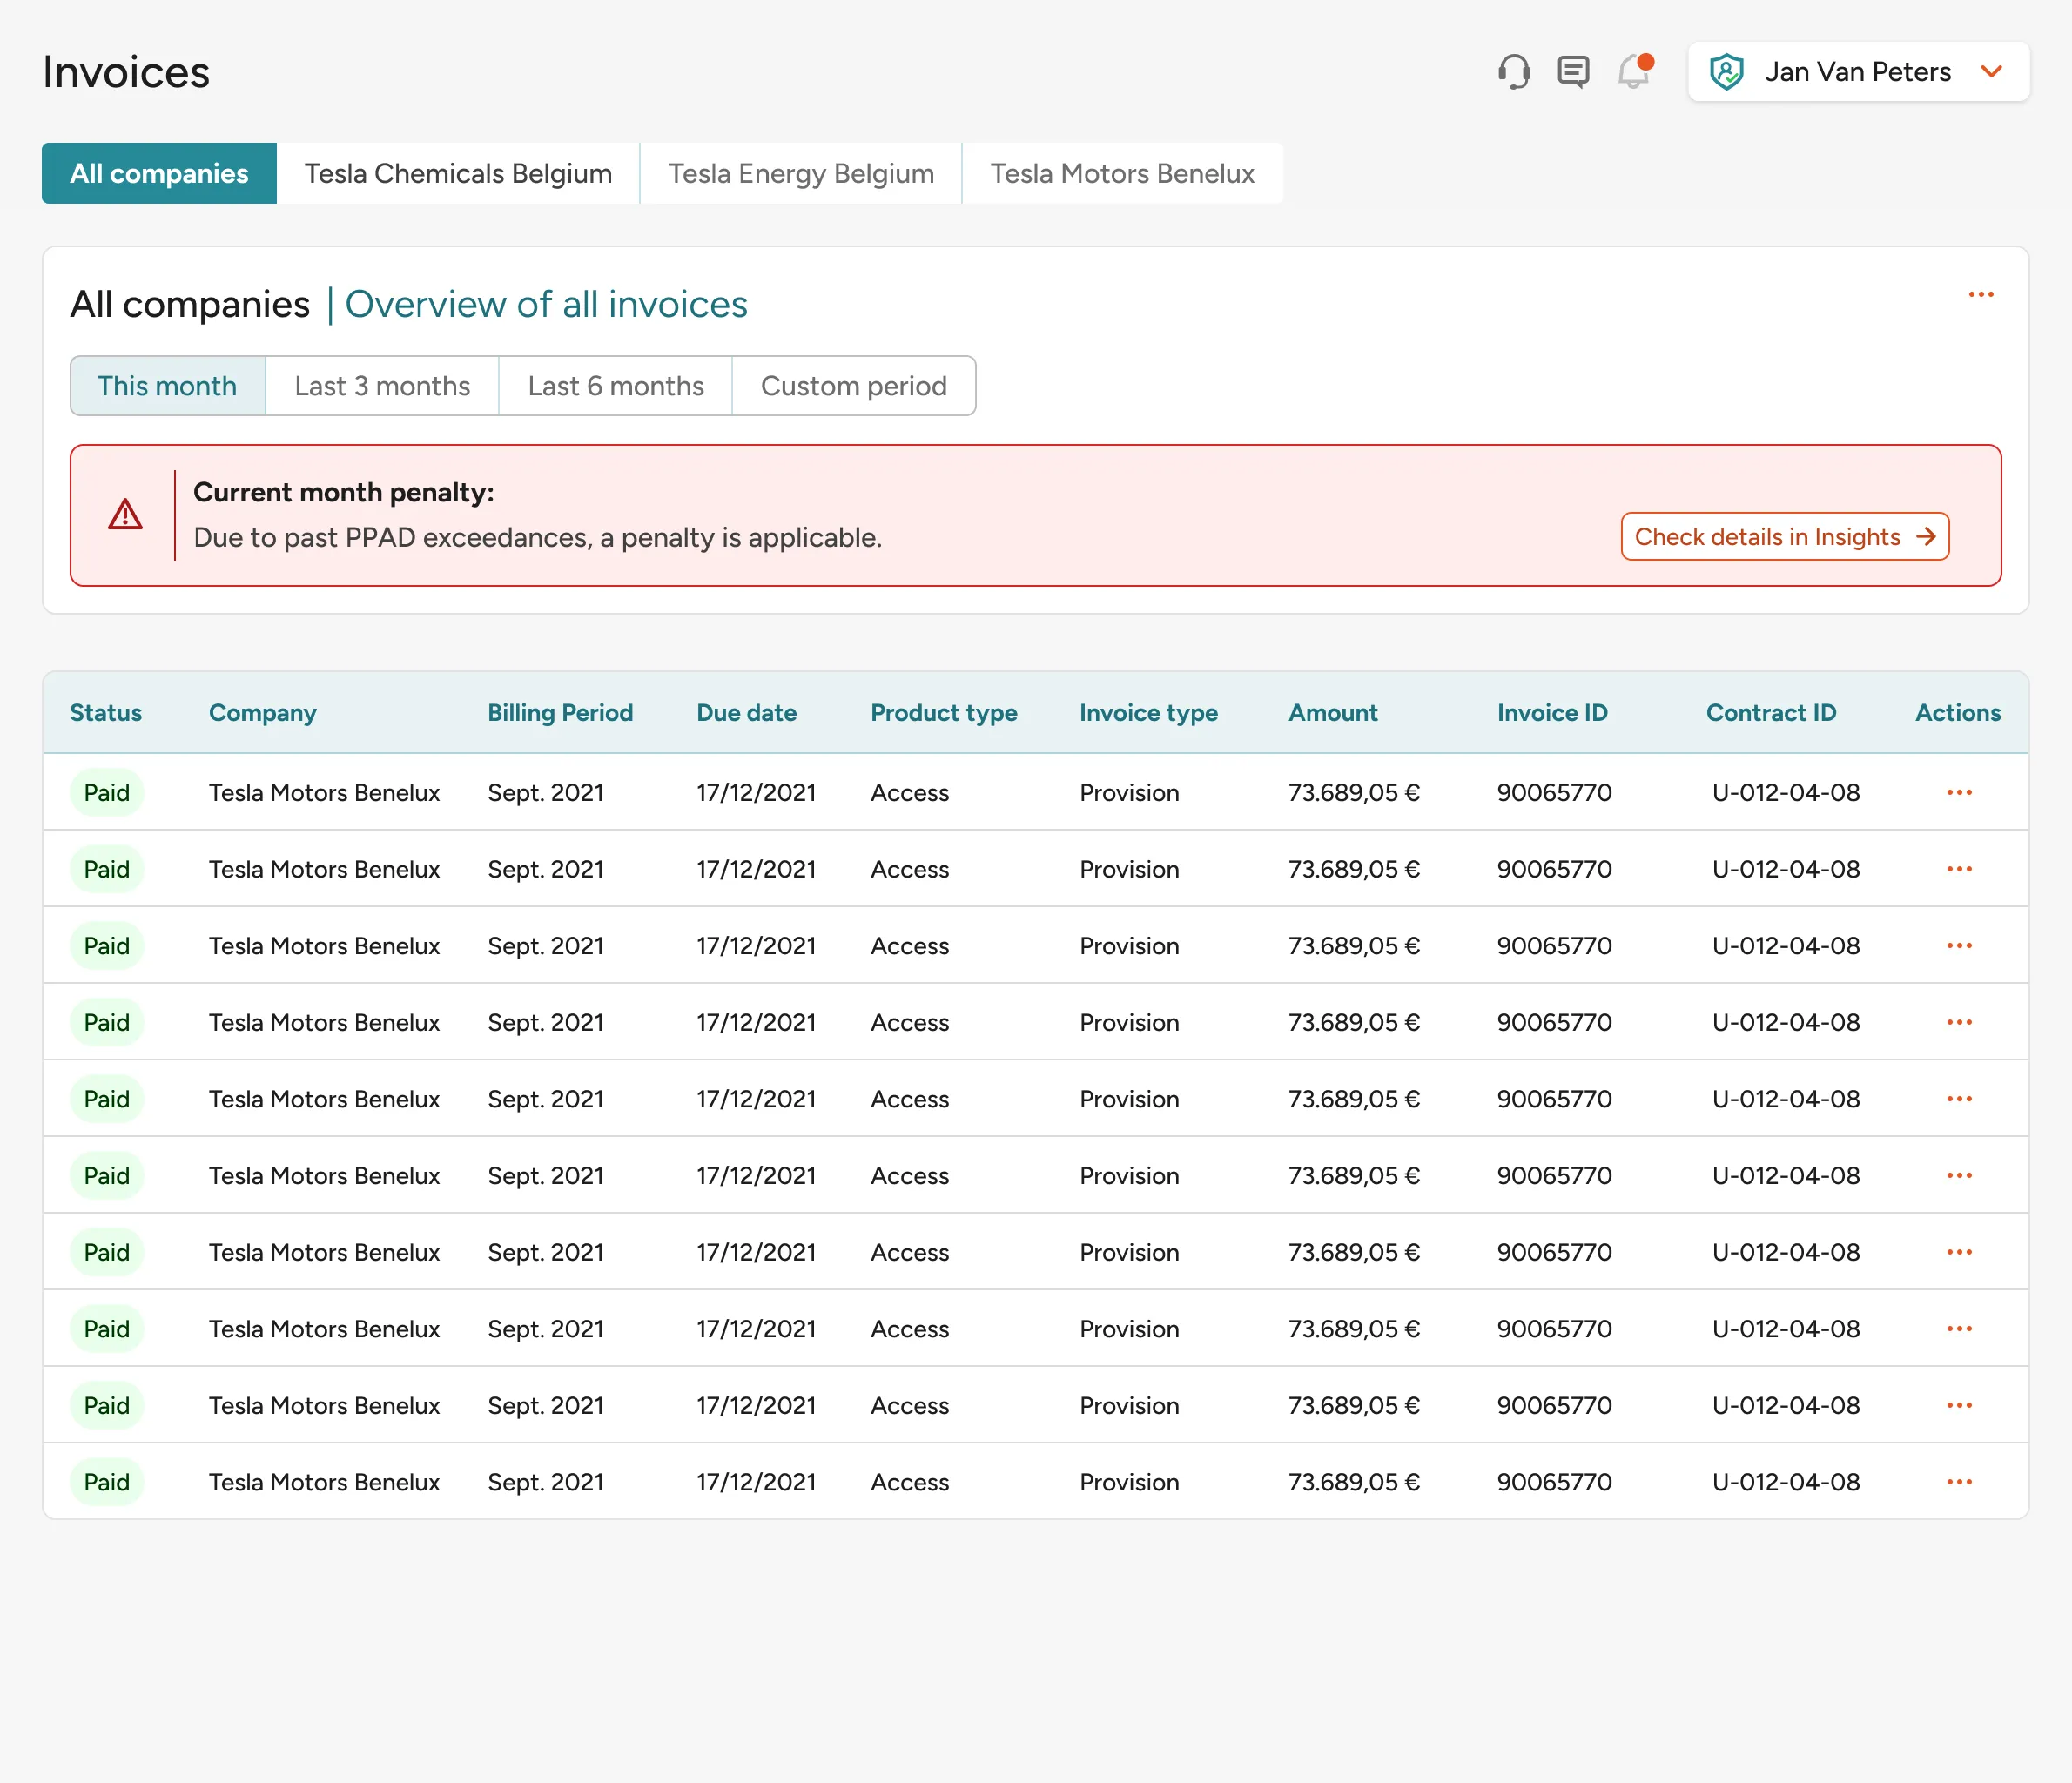
Insights: a PPAD exceedance, from metering to the invoice
When an access point exceeds its contractual power put at disposal (PPAD), the information follows the client from screen to screen, all the way to the invoice. Four screens of the journey, redesigned in 2026 on Nova, Elia's design system, with fictitious data.
03 Connection Lifecycle
Mapping the grid connection journey.
Context
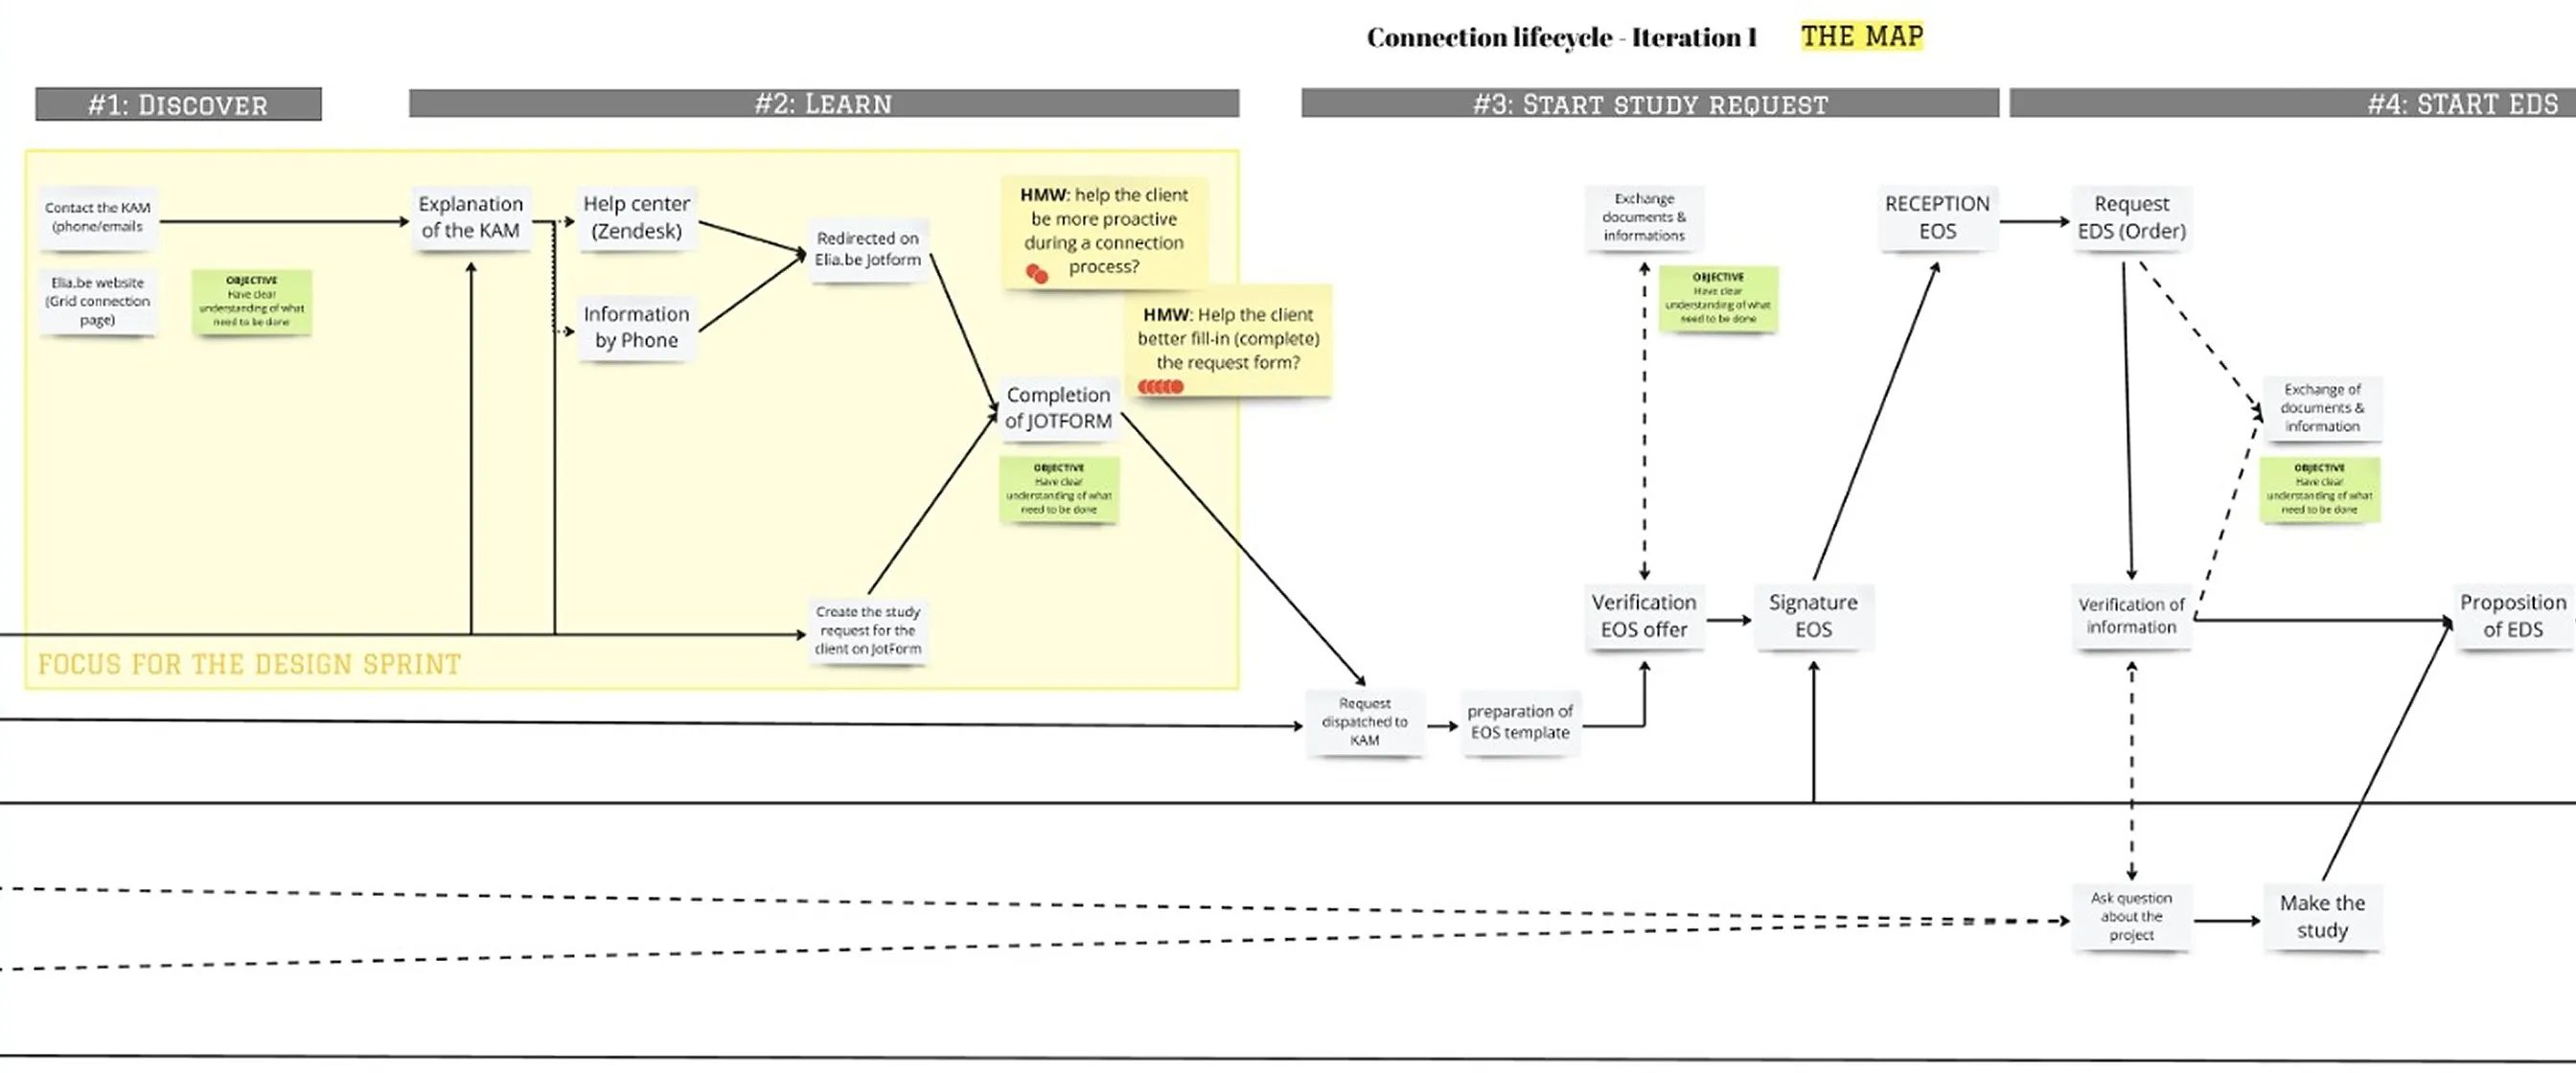
Connecting to the high-voltage grid means a chain of studies, offers, signatures and document exchanges between the client, their Key Account Manager and several Elia departments. KAMs needed to see that journey as a whole, from first contact to day-to-day management, to find where it got stuck. I designed and facilitated a two-day Design Sprint to map it and draw a first testable answer from it.
Objectives
- See the whole journey — make every step of the service visible to find blockers and room for improvement.
- Connect business and design — align Key Account Managers, technical teams and product owners on a shared roadmap.
- Formalise a long-term vision — lay down a service blueprint and a long-term goal in two days of workshop.
Approach & solutions
- Two-day Design Sprint — a short format to frame the project with the people involved.
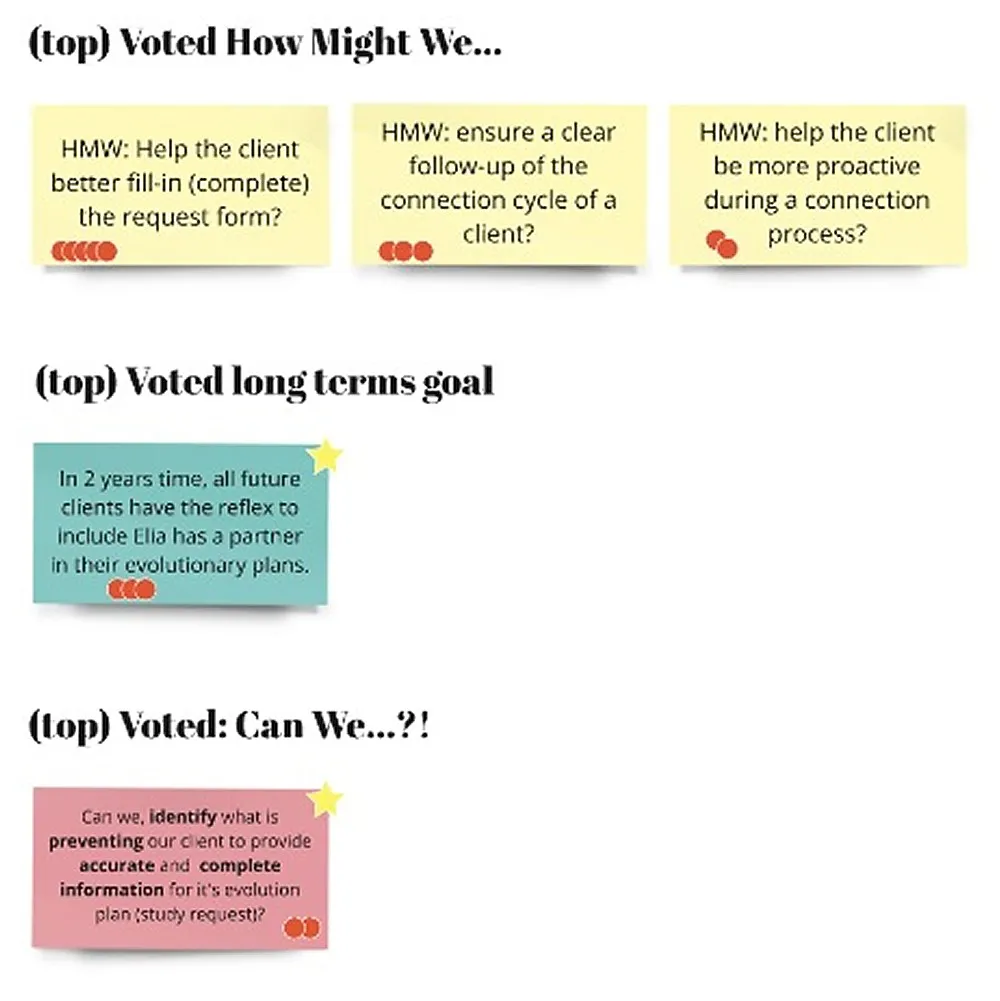
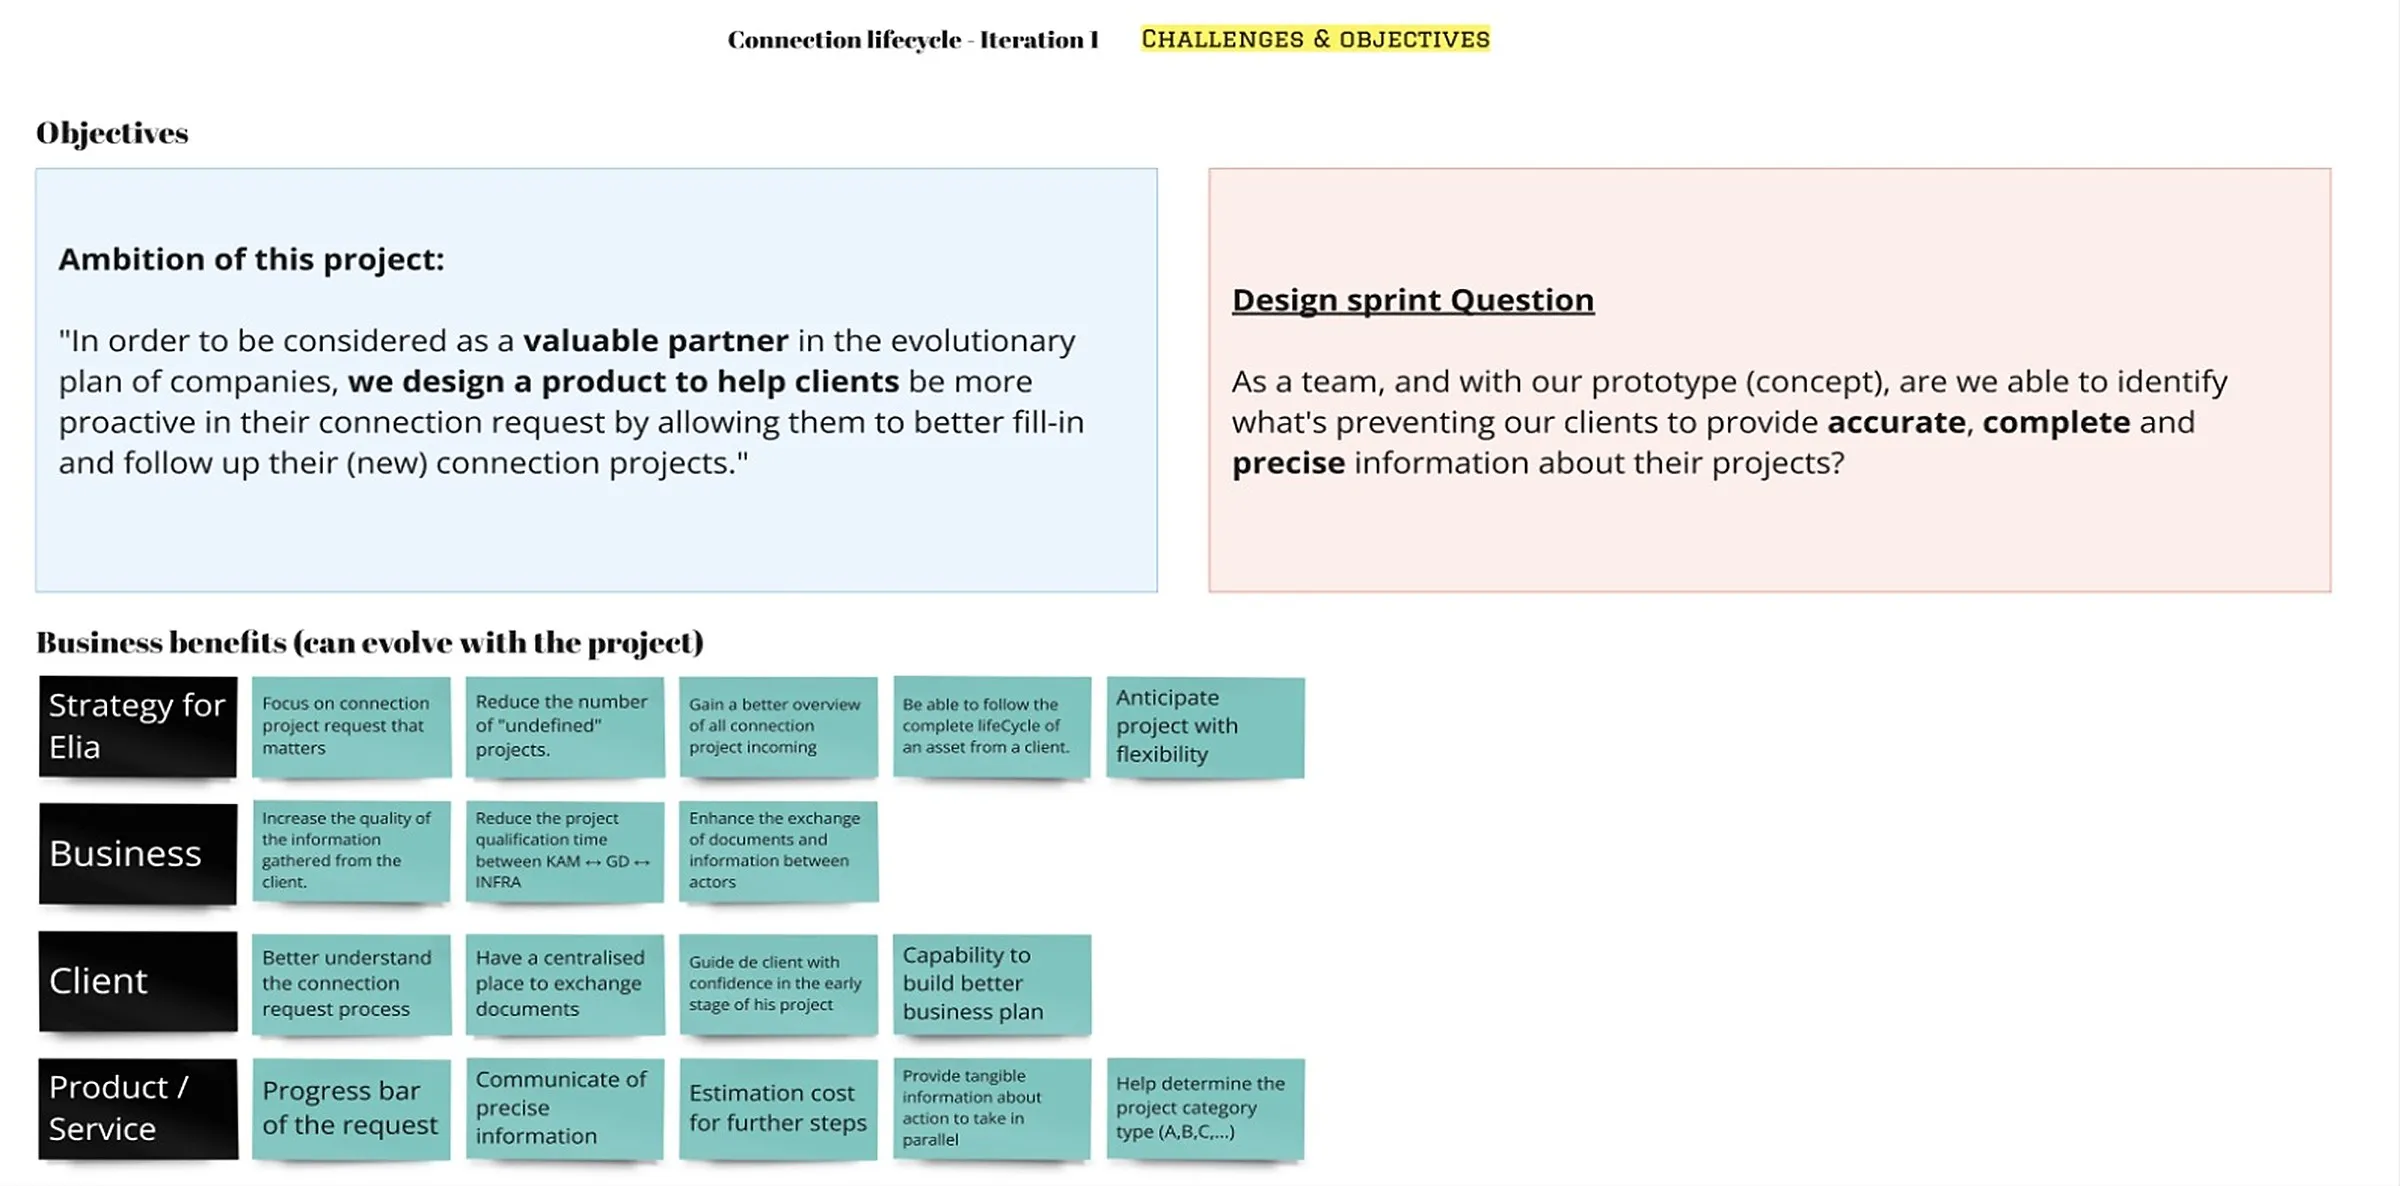
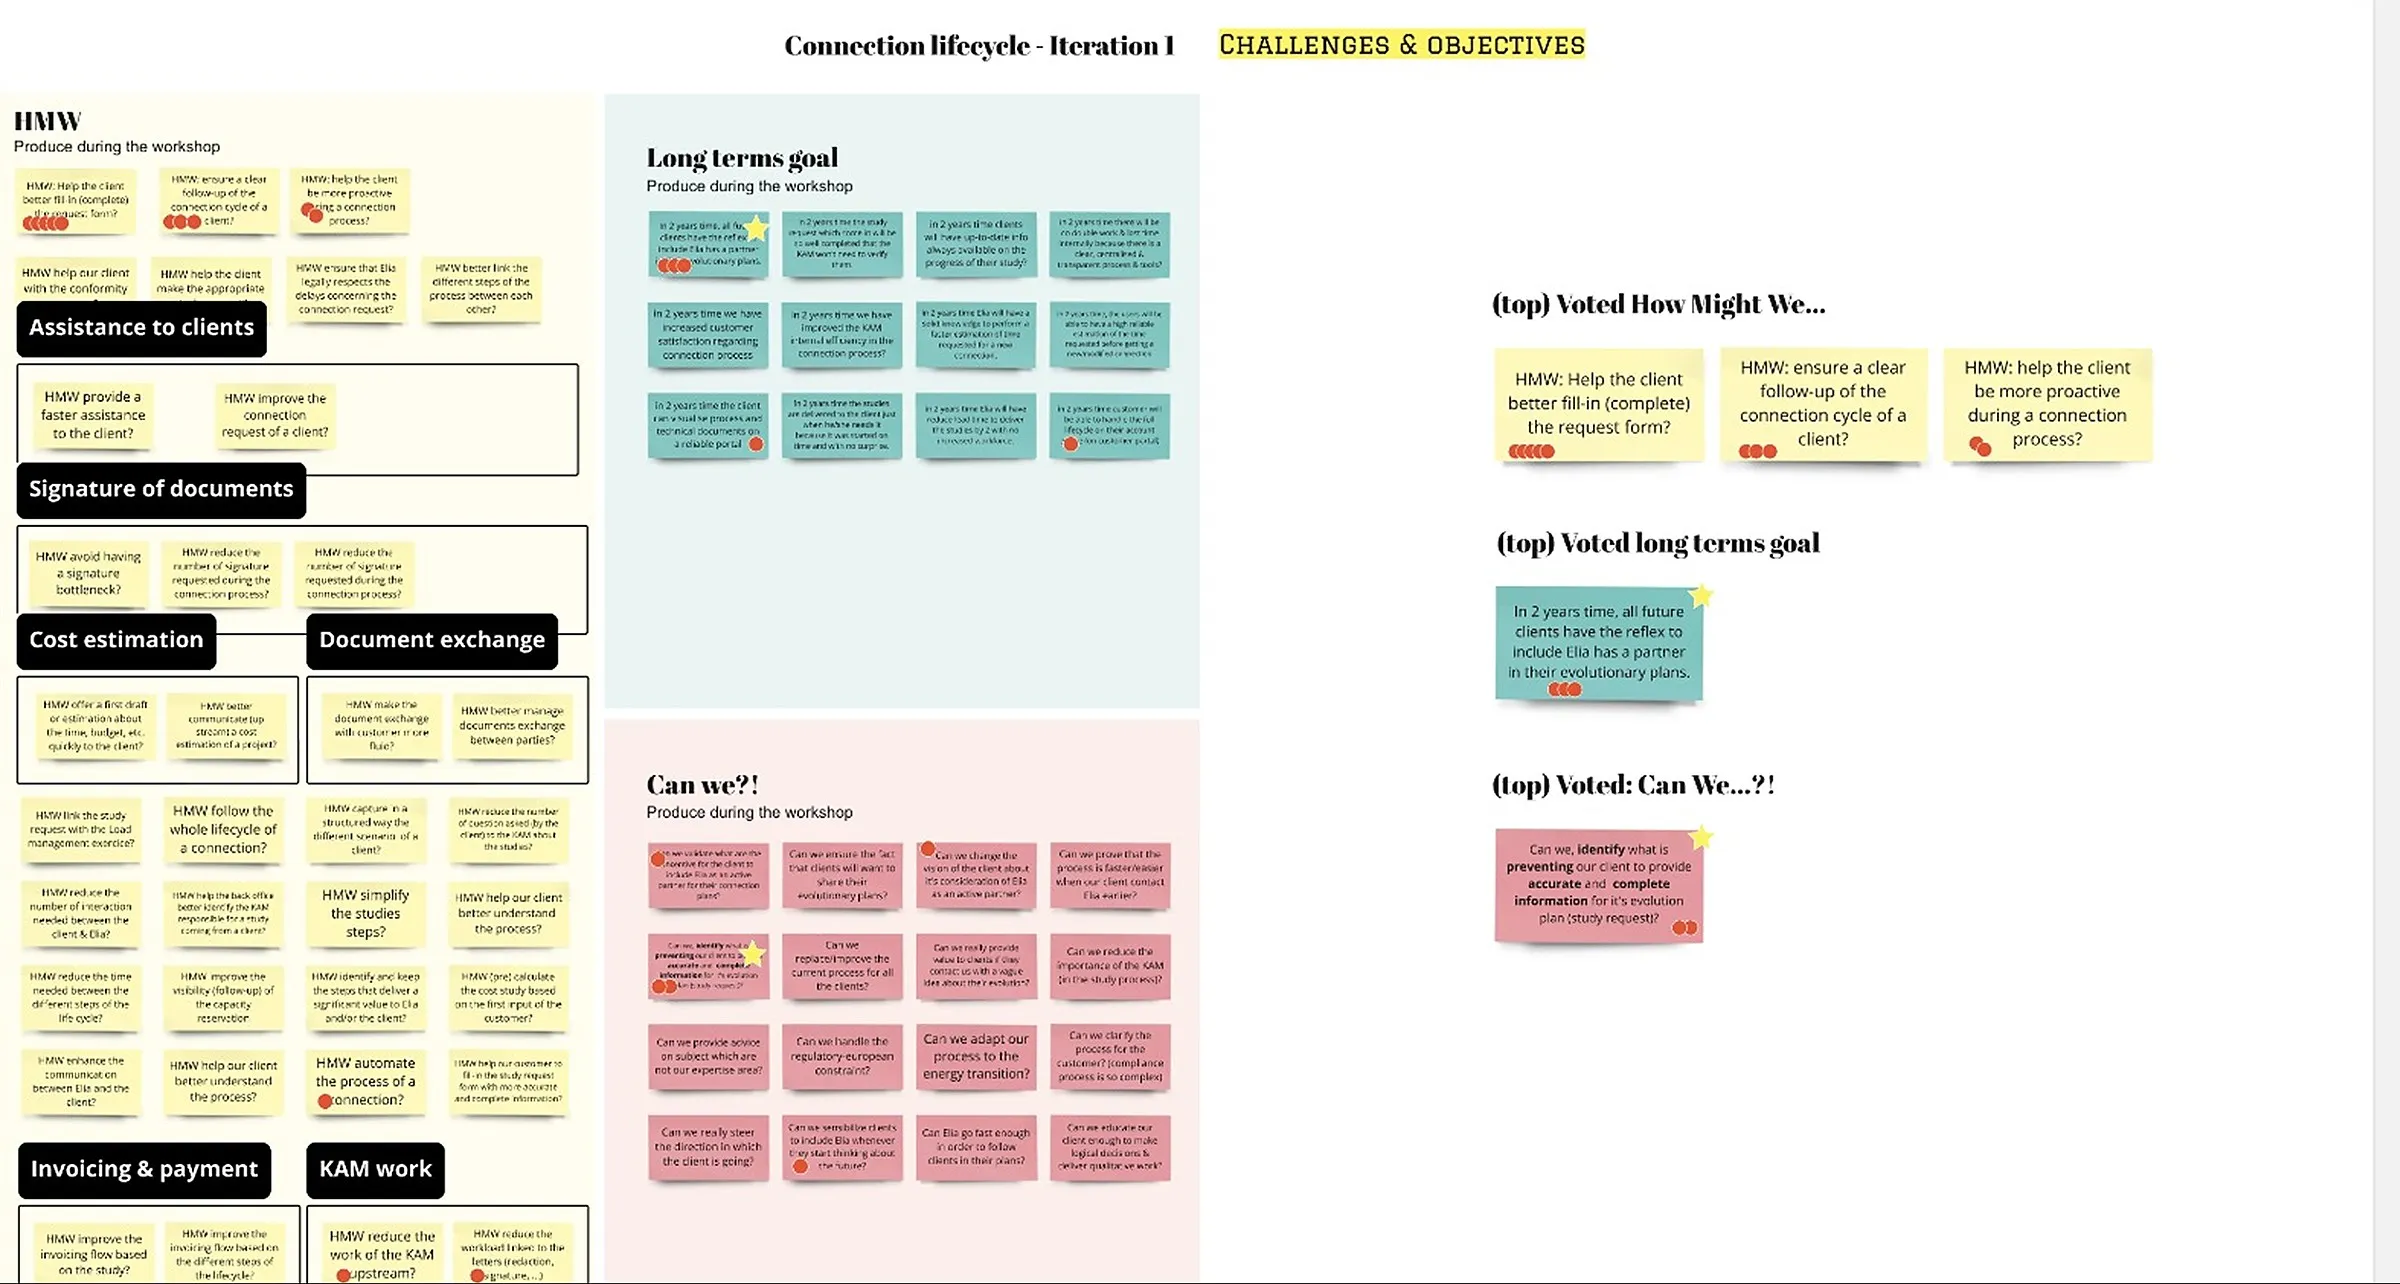
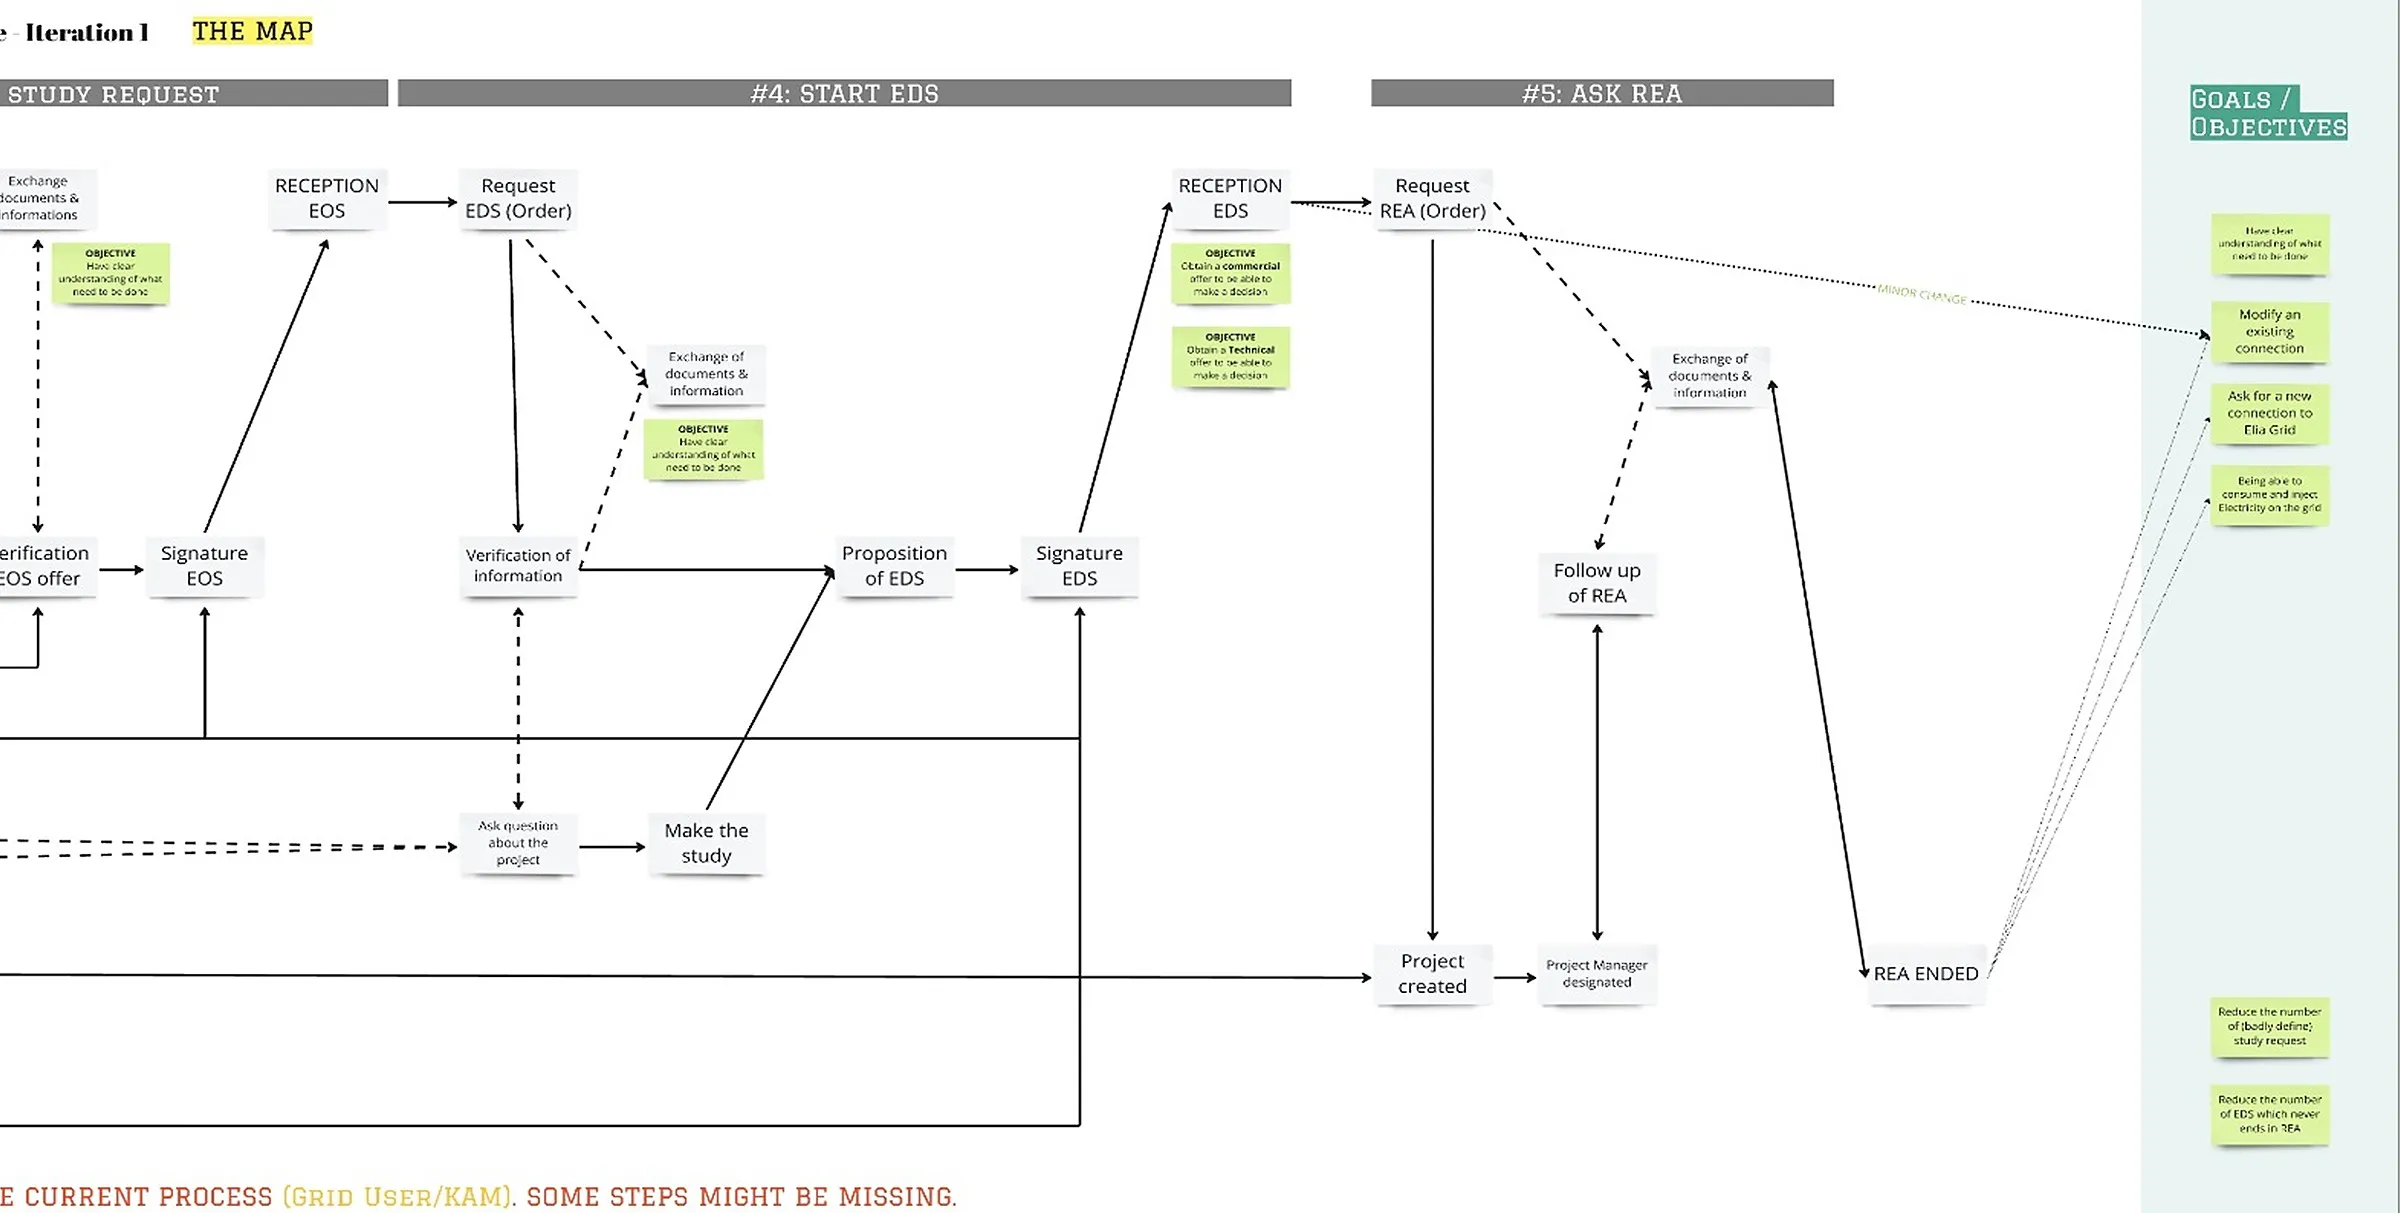
- Day 1: align and map — objectives, expected benefits per stakeholder, then the “map” of the current journey, on which the team placed its How Might We notes where solving them would change the most.
- Day 2: ideas and user flows — concepts chosen by vote, the sprint question, then user flows.
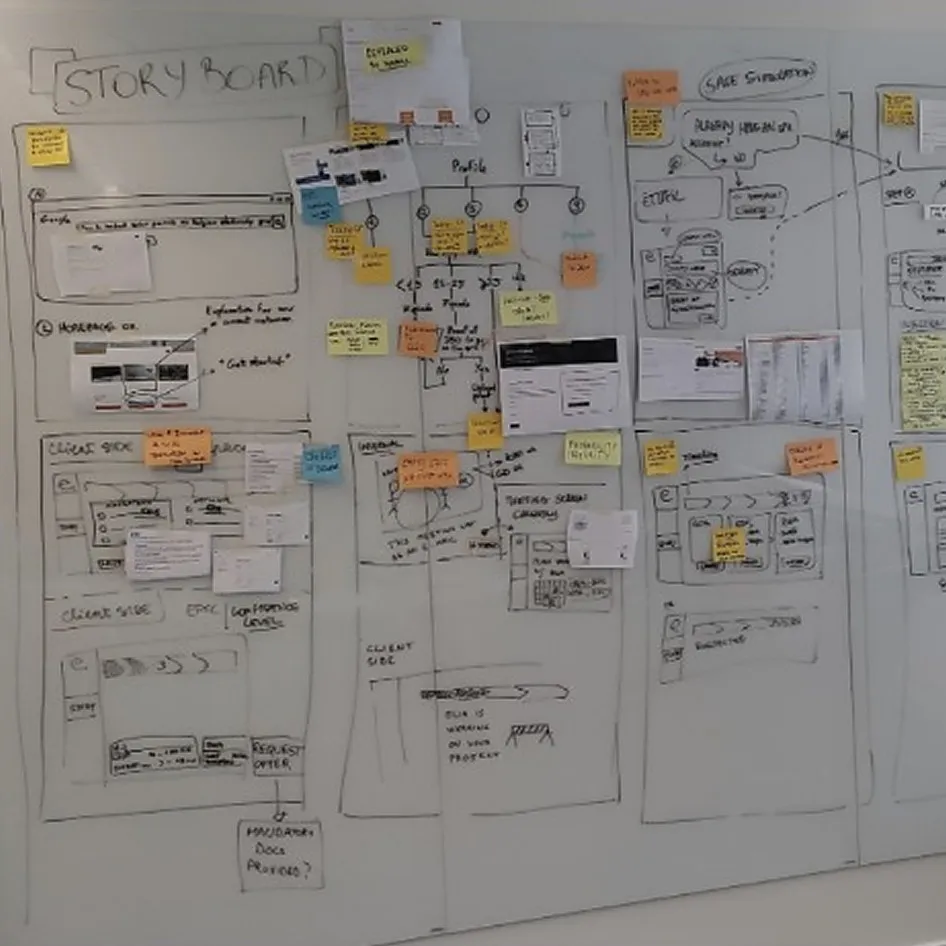
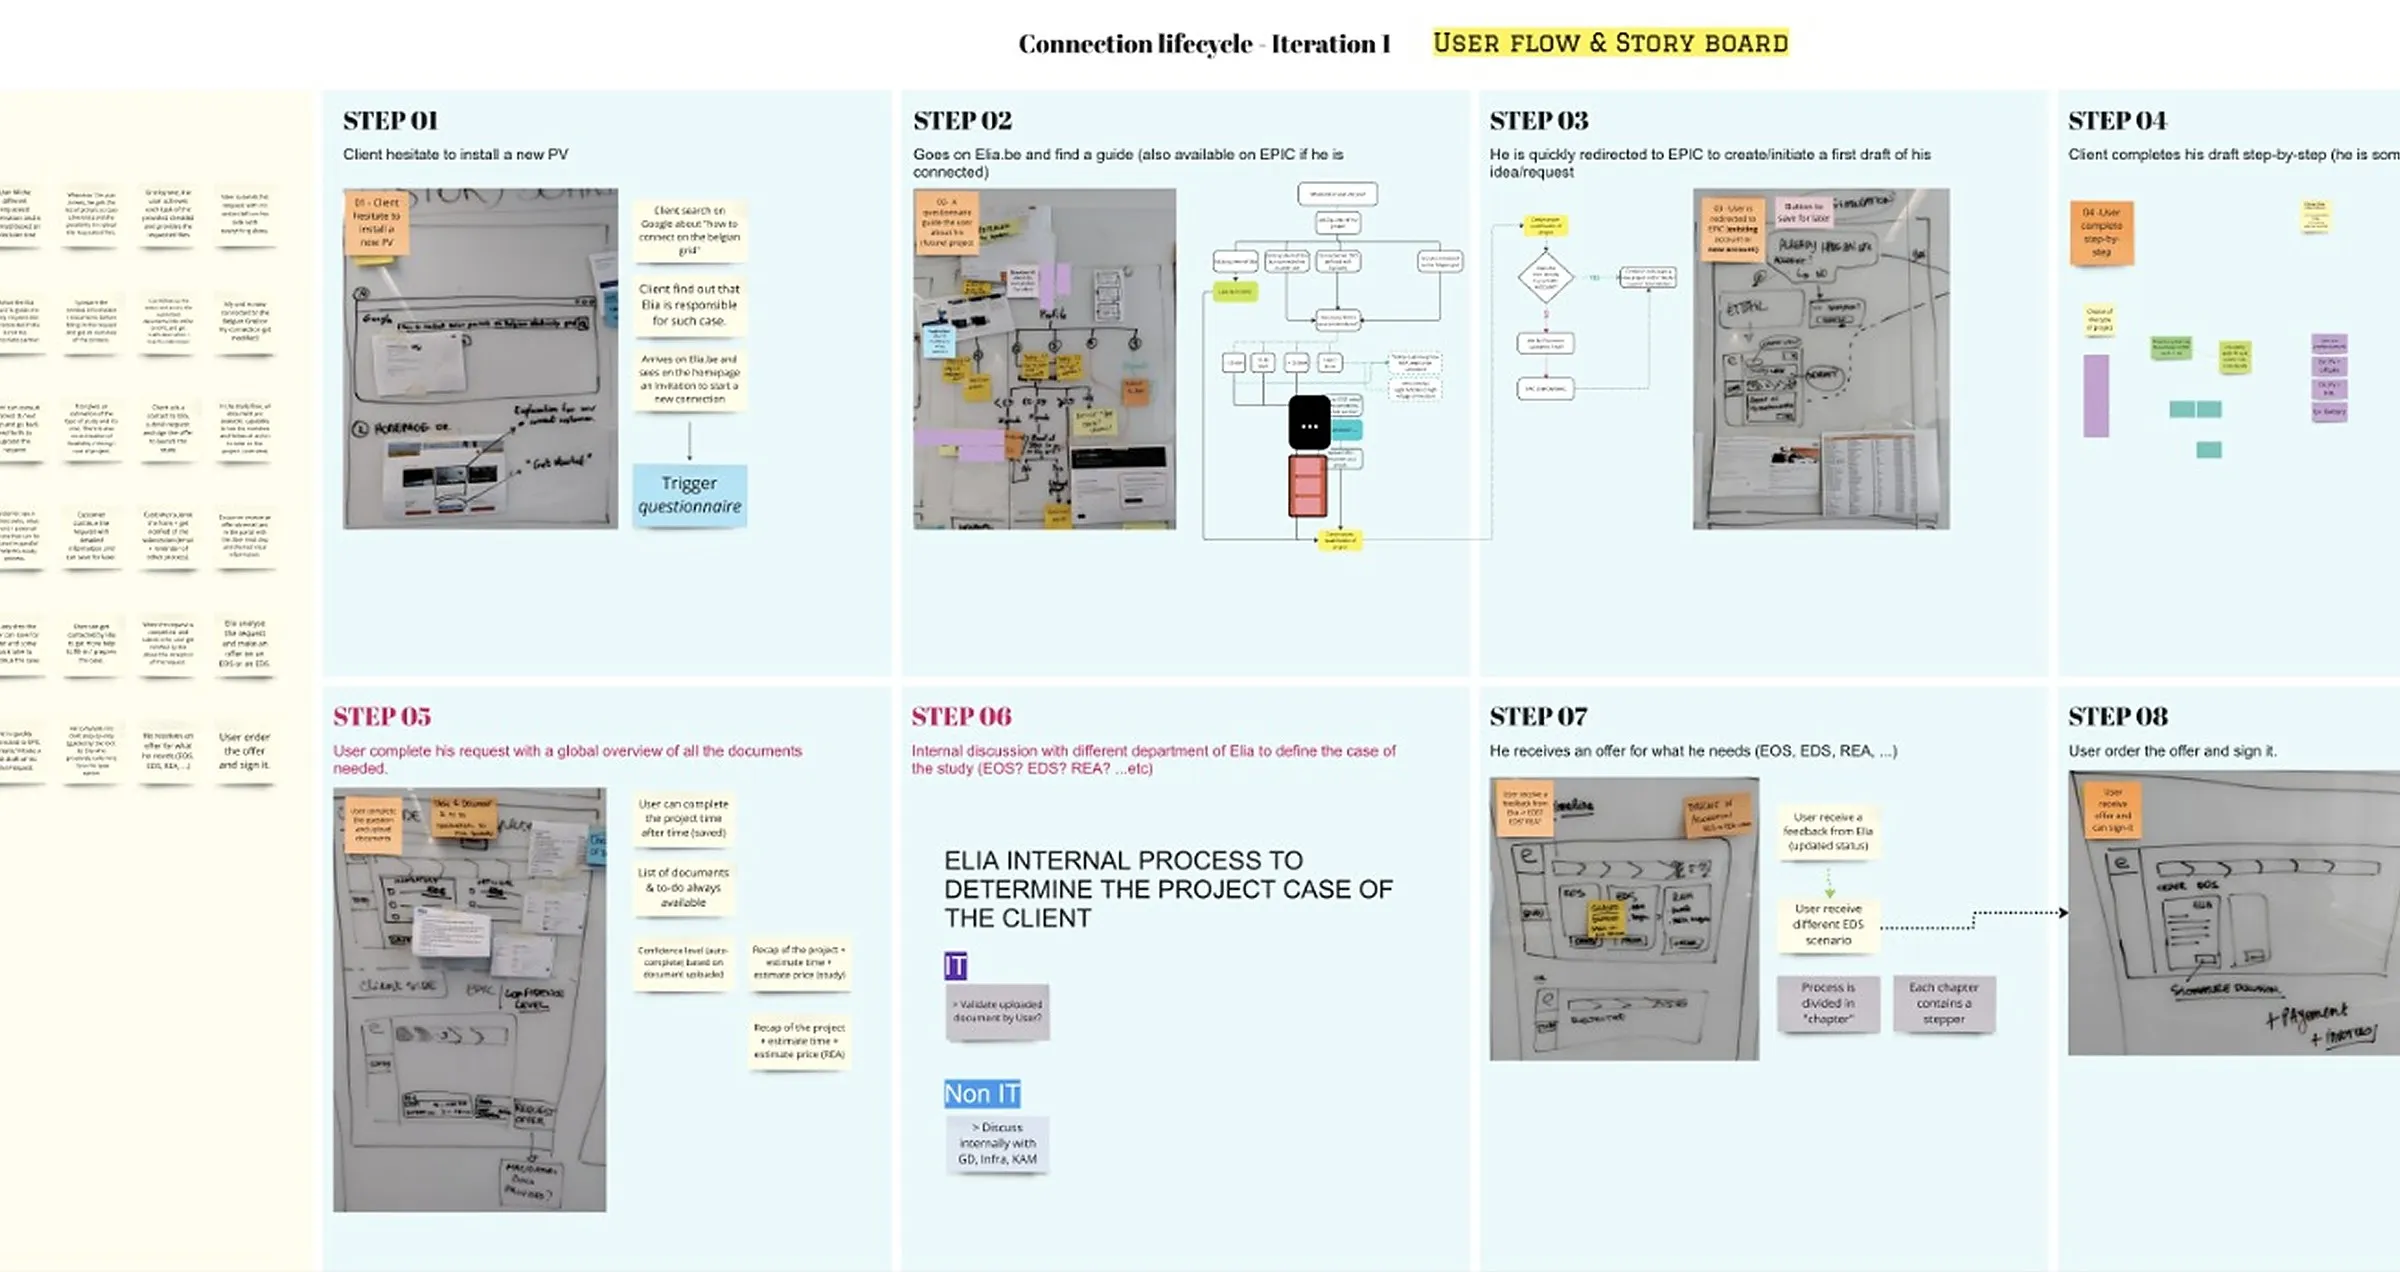
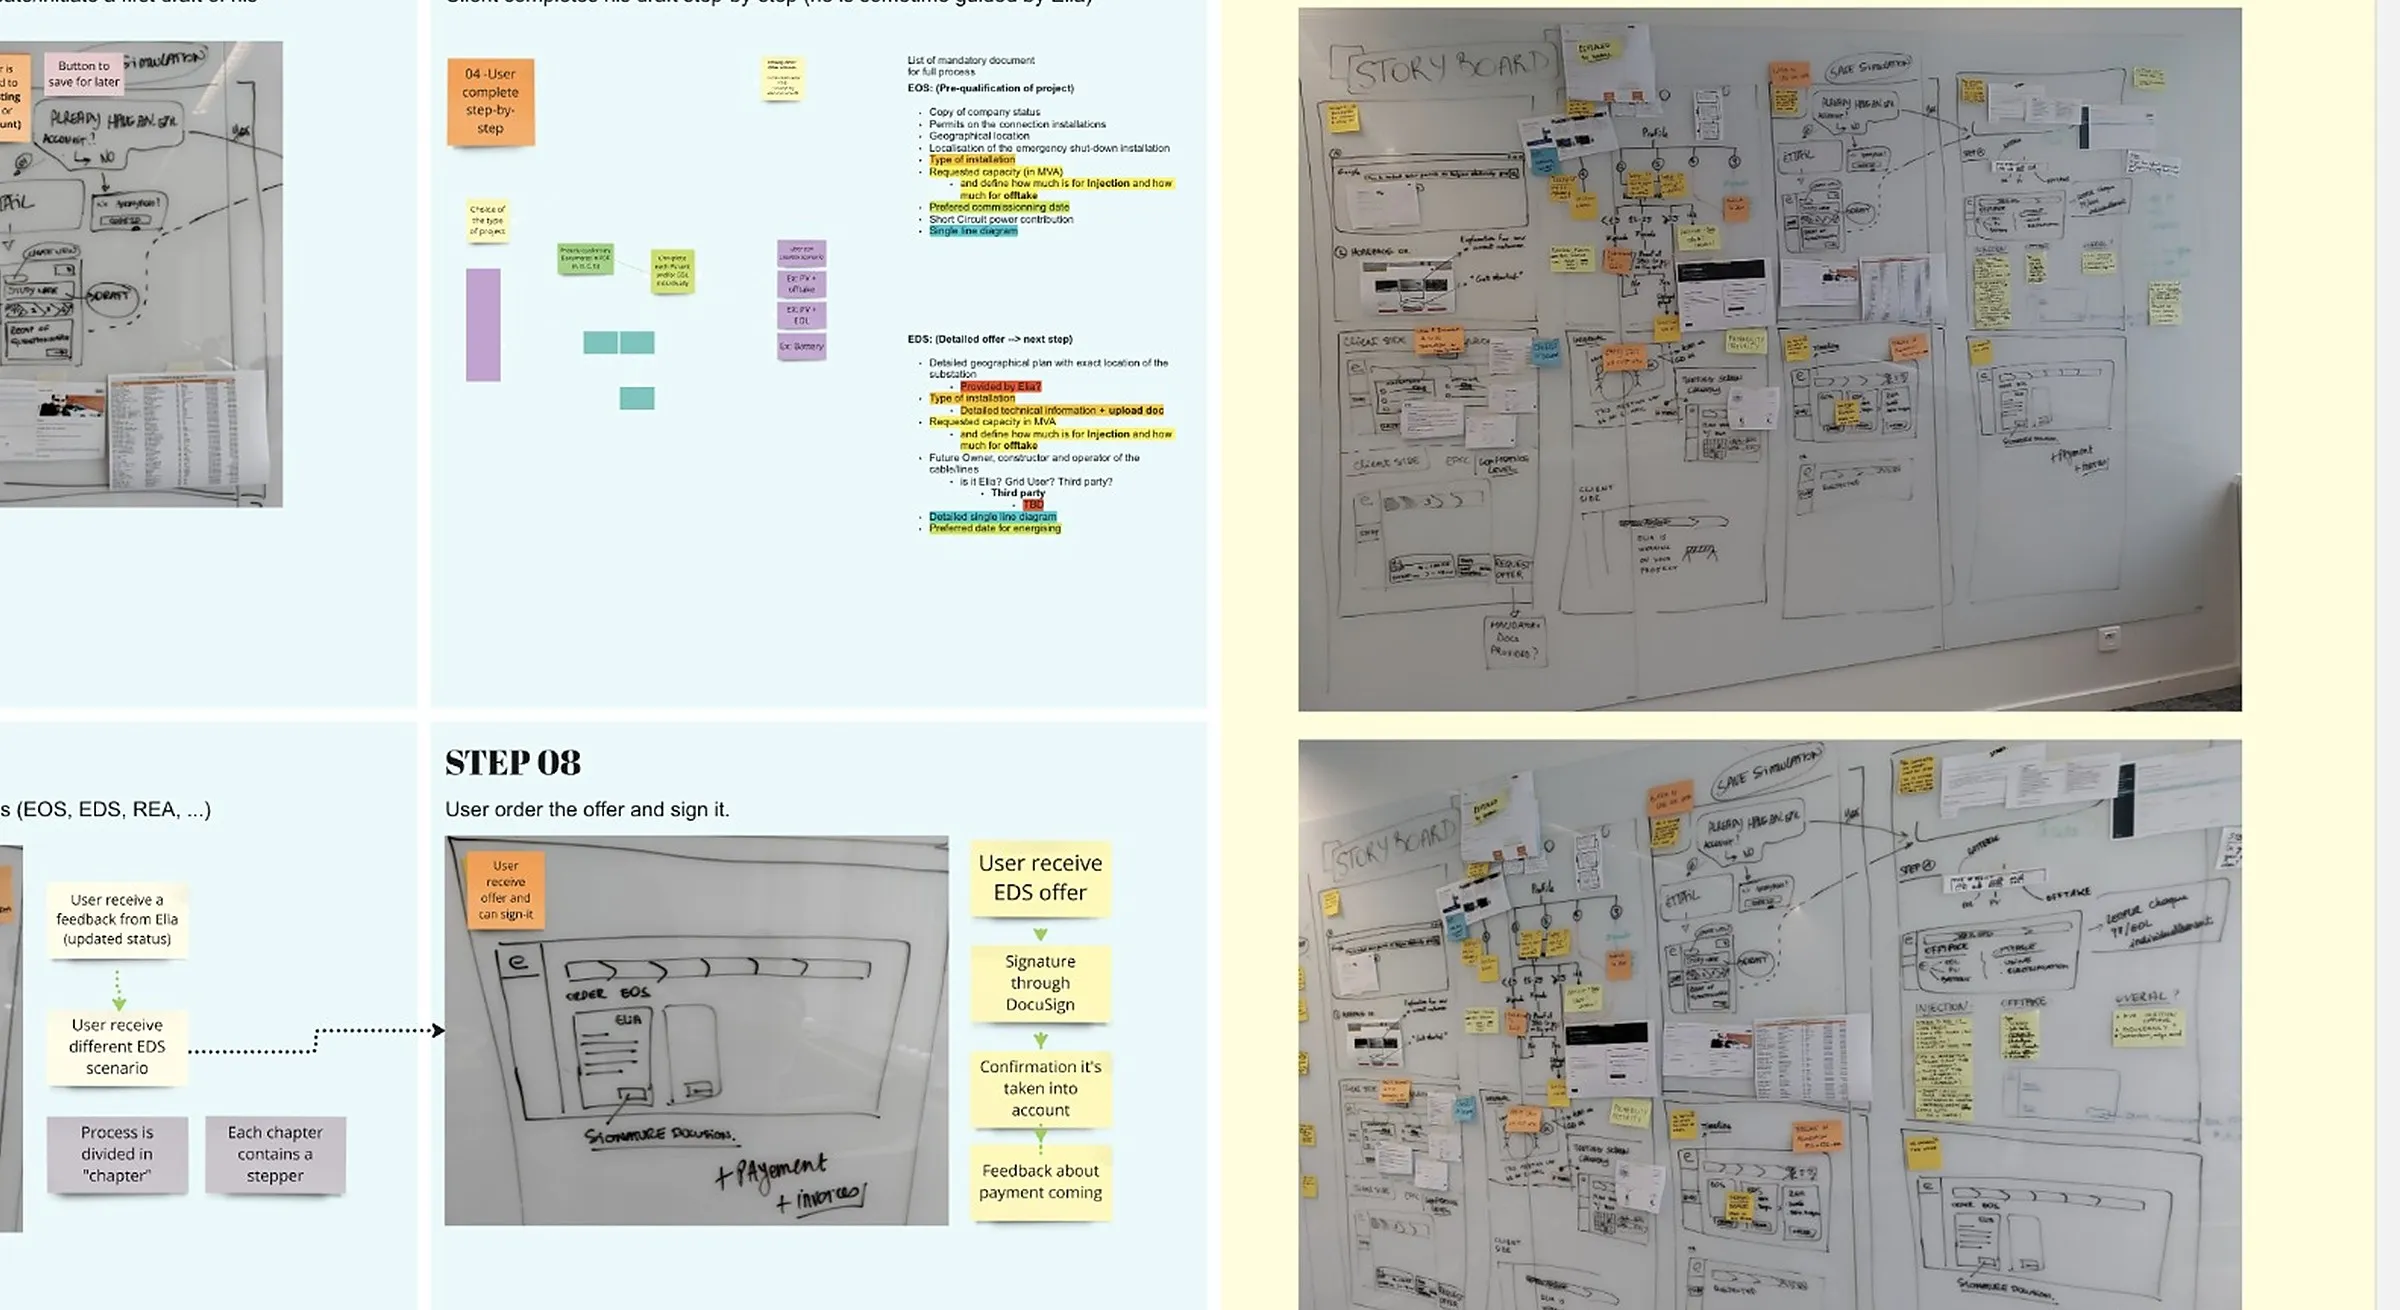
- Eight-step storyboard — from a client considering a project to the signed offer, to pin down the key interactions to prototype.
- Everything recorded on Miro — every decision is noted on the boards, so the team can refer to it after the workshop.
Results
- Hypotheses checked before launch — workload and priorities split into stages, based on what IT and the organisation could absorb.
- Written objectives — what the client must be able to do at each step of the connection, and the UX objectives for the rest of the project.
What the sprint produced
Captures of the Miro boards produced during the two workshop days, which I designed and facilitated. They date from the workshop itself: the resolution is the original one.
Continue reading
Two other B2B ecosystems.
Financial institution
Swift La Hulpe
Redesign of the financial disputes Case Management and contribution to the Design System through the UX Community of Excellence.
Telecom
Proximus
Twenty-five interviews with freelancers to redesign the Bizz Online page (+38% conversion), then research on price perception.